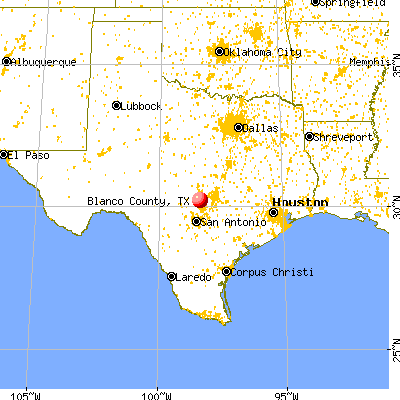
Blanco County, Texas (TX)
County owner-occupied free and clear houses and condos in 2010: 1,601
County owner-occupied houses and condos in 2000: 2,597
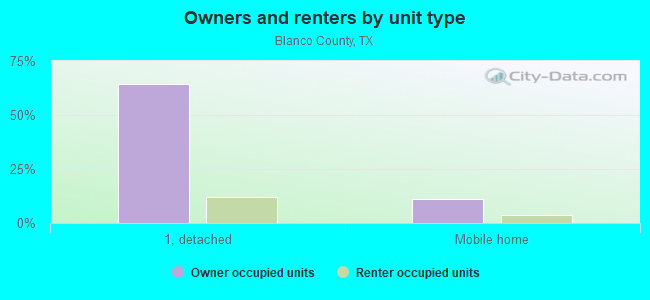
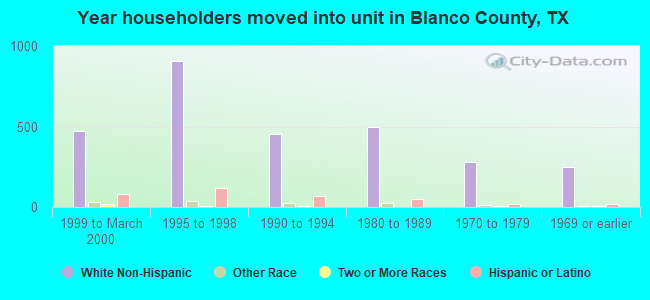
Renter-occupied apartments: 882 (it was 706 in 2000)
| % of renters here: | 21% |
| State: | 36% |
Land area: 711 sq. mi.
Water area: 2.2 sq. mi.
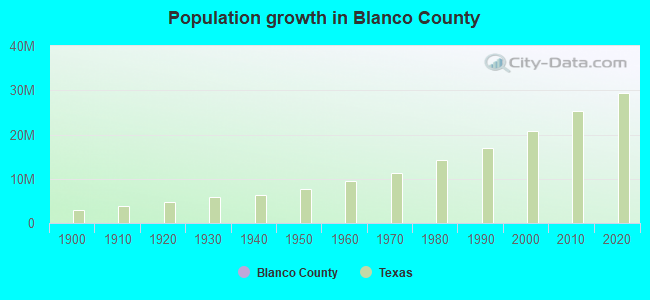
Population density: 17 people per square mile (low).
Industries providing employment: Construction (17.7%), Educational, health and social services (16.4%), Professional, scientific, management, administrative, and waste management services (13.0%), Manufacturing (10.2%), Retail trade (10.1%).
Type of workers:
- Private wage or salary: 74%
- Government: 17%
- Self-employed, not incorporated: 10%
- Unpaid family work: 0%
- OSM Map
- General Map
- Google Map
- MSN Map

- 8,61073.0%White Non-Hispanic Alone
- 2,40220.4%Hispanic or Latino
- 5654.8%Two or more races
- 960.8%Asian alone
- 790.7%Native Hawaiian and Other
Pacific Islander alone - 230.2%Black Non-Hispanic Alone
- 200.2%American Indian and Alaska Native alone

| Median resident age: | 50.1 years |
| Texas median age: | 35.6 years |
| Males: 6,011 | |
| Females: 5,909 |

 | Waco-Austin-San Antonio Mega Region? (91 replies) |
| New Lanes Open on I-10 EB (79 replies) |
| Will Austin and San Antonio become one single Metro by 2030 (36 replies) |
| Need help with area cultures around Austin/San Antonio (27 replies) |
| Fire season here, play it safe (2 replies) |
| Favorite Day Trip/Vacation Spots in Texas (16 replies) |
| Blanco County: | 2.0 people |
| Texas: | 3 people |
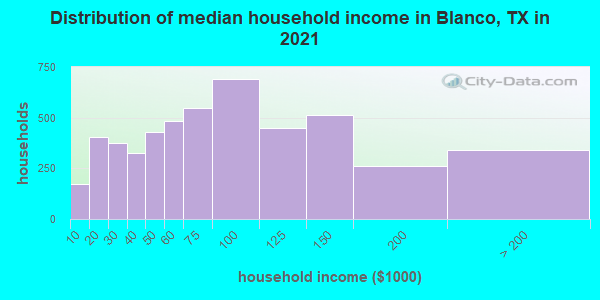
Estimated median household income in 2022: $78,897 ($39,369 in 1999)
| This county: | $78,897 |
| Texas: | $72,284 |
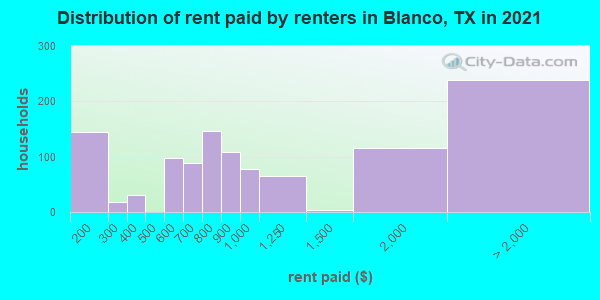
Median contract rent in 2022 for apartments: $778 (lower quartile is $375, upper quartile is $1,015)
| This county: | $778 |
| State: | $1117 |
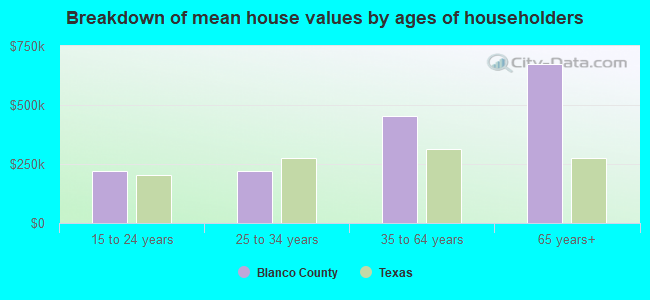
Estimated median house or condo value in 2022: $358,483 (it was $98,300 in 2000)
| Blanco: | $358,483 |
| Texas: | $275,400 |
Median monthly housing costs for homes and condos with a mortgage: $1,774
Median monthly housing costs for units without a mortgage: $621
Institutionalized population: 98
Crime in 2021 (reported by the sheriff's office or county police, not the county total):
- Murders: 1
- Rapes: 4
- Robberies: 2
- Assaults: 11
- Burglaries: 27
- Thefts: 55
- Auto thefts: 3
Crime in 2020 (reported by the sheriff's office or county police, not the county total):
- Murders: 1
- Rapes: 0
- Robberies: 0
- Assaults: 24
- Burglaries: 19
- Thefts: 37
- Auto thefts: 1
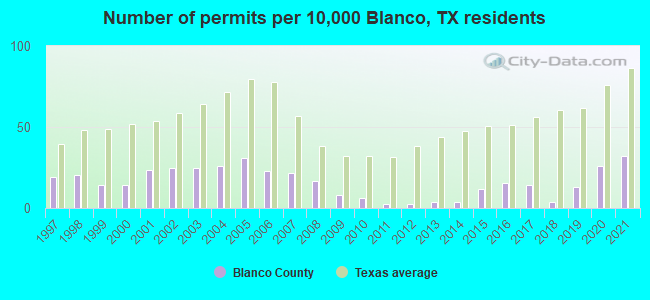
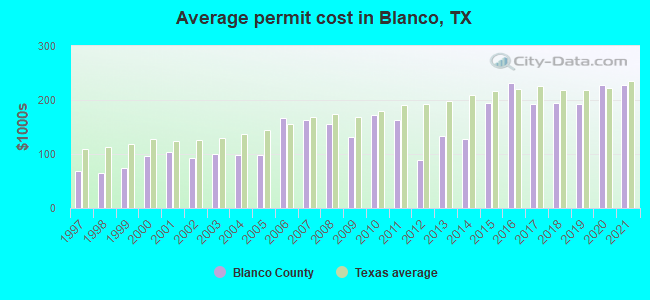
Single-family new house construction building permits:
- 2022: 24 buildings, average cost: $211,000
- 2021: 27 buildings, average cost: $226,900
- 2020: 22 buildings, average cost: $226,600
- 2019: 11 buildings, average cost: $191,800
- 2018: 3 buildings, average cost: $195,200
- 2017: 12 buildings, average cost: $192,500
- 2016: 13 buildings, average cost: $232,400
- 2015: 10 buildings, average cost: $195,200
- 2014: 3 buildings, average cost: $128,400
- 2013: 3 buildings, average cost: $132,700
- 2012: 2 buildings, average cost: $87,500
- 2011: 2 buildings, average cost: $162,500
- 2010: 5 buildings, average cost: $171,500
- 2009: 7 buildings, average cost: $132,200
- 2008: 14 buildings, average cost: $154,900
- 2007: 18 buildings, average cost: $162,800
- 2006: 19 buildings, average cost: $165,800
- 2005: 26 buildings, average cost: $98,000
- 2004: 22 buildings, average cost: $99,200
- 2003: 21 buildings, average cost: $100,400
- 2002: 21 buildings, average cost: $93,100
- 2001: 20 buildings, average cost: $104,000
- 2000: 12 buildings, average cost: $95,800
- 1999: 12 buildings, average cost: $74,500
- 1998: 17 buildings, average cost: $65,100
- 1997: 16 buildings, average cost: $69,000
Median real estate property taxes paid for housing units with mortgages in 2022: $4,487 (1.0%)
Median real estate property taxes paid for housing units with no mortgage in 2022: $2,755 (1.0%)

| Blanco County: | 9.8% |
| Texas: | 14.0% |
Median age of residents in 2022: 50.1 years old
(Males: 48.5 years old, Females: 51.3 years old)
(Median age for: White residents: 55.9 years old, Black residents: 46.6 years old, American Indian residents: 52.4 years old, Asian residents: 54.0 years old, Hispanic or Latino residents: 34.3 years old, Other race residents: 41.1 years old)
Fair market rent in 2006 for a 1-bedroom apartment in Blanco County is $414 a month.
Fair market rent for a 2-bedroom apartment is $523 a month.
Fair market rent for a 3-bedroom apartment is $687 a month.
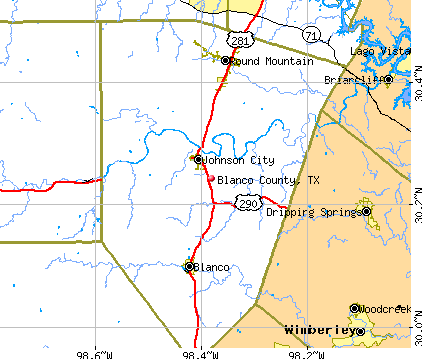
Cities in this county include: Blanco, Johnson City, Round Mountain.
Notable locations in this county outside city limits:
Notable locations in Blanco County: Cherry Spring Community Centery (A), Little Windmill (B), North Windmill (C), Old Windmill (D), Rock House Windmill (E), Rodgers Trap Windmill (F), Eckert Pumping Station (G), Wrede Community House (H), AK Bar Ranch (I), Ahrens Ranch (J), Arhelger Ranch (K), Bauer Ranch (L), Brehmer Ranch (M), Circle D Ranch (N), Cottonwood Ranch (O), Danz Ranch (P), Franz Ranch (Q), Gellermann Ranch (R), Gold Ranch (S), Koennecke Ranch (T). Display/hide their locations on the map
Churches in Blanco County include: Squaw Creek Church (A), American Church (B), Cave Creek Church (C). Display/hide their locations on the map
Cemeteries: Marschall Meusebach (1), Evers Cemetery (2), Wendel Cemetery (3), Schugh Cemetery (4), Saint John Cemetery (5), Welgehausen Cemetery (6), Welge Cemetery (7). Display/hide their locations on the map
Lakes and reservoirs: Holly Pond (A), Soil Conservation Service Site 4 Reservoir (B), Lyndon B Johnson State Park Lake (C), Soil Conservation Service Site 3 Reservoir (D), Soil Conservation Service Site 2 Reservoir (E), Soil Conservation Service Site 1 Reservoir (F), Douglass Lake (G), Petersen Site 1 Lake (H). Display/hide their locations on the map
Streams, rivers, and creeks: Big Branch (A), Bee Creek (B), White Oak Creek (C), West Fork Williams Creek (D), West Fork Threemile Creek (E), Stuckens Branch (F), Stolles Creek (G), Spring Branch (H), Spanish Oak Creek (I). Display/hide their locations on the map
Parks in Blanco County include: Lyndon Baines Johnson State Historical Park (1), Lyndon B Johnson National Historical Park (2). Display/hide their locations on the map
Neighboring counties: Gadsden County, Florida  , Brazos County , St. John the Baptist Parish, Louisiana , Union County, Florida , Hardin County , Mason County
  .
.
| Here: | 2.3% |
| Texas: | 3.5% |

Current college students: 196
People 25 years of age or older with a high school degree or higher: 90.3%
People 25 years of age or older with a bachelor's degree or higher: 30.6%
Number of foreign born residents: 836 (48.5% naturalized citizens)
| Blanco County: | 7.0% |
| Whole state: | 17.2% |
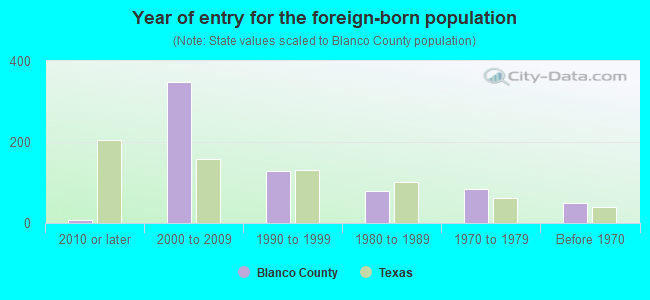
- Year of entry for the foreign-born population
- 262010 or later
- 3442000 to 2009
- 1361990 to 1999
- 791980 to 1989
- 851970 to 1979
- 49Before 1970
Mean travel time to work (commute): minutes
Percentage of county residents living and working in this county: 99.8%
Housing units in structures:
- One, detached: 5,058
- One, attached: 20
- Two: 56
- 3 or 4: 145
- 5 to 9: 203
- 10 to 19: 26
- 20 to 49: 9
- 50 or more: 5
- Mobile homes: 687
- Boats, RVs, vans, etc.: 58
Housing units in Blanco County with a mortgage: 1,865 (36 second mortgage, 0 home equity loan, 28 both second mortgage and home equity loan)
Houses without a mortgage: 53
| Here: | 1.9% with mortgage |
| State: | 98.4% with mortgage |
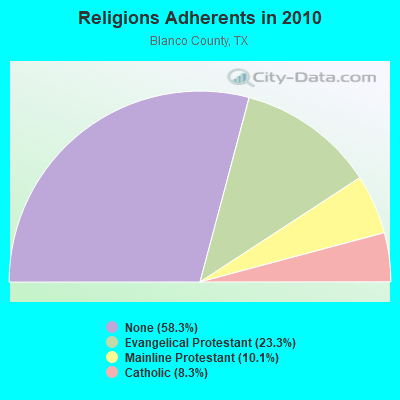
Religion statistics for Blanco County
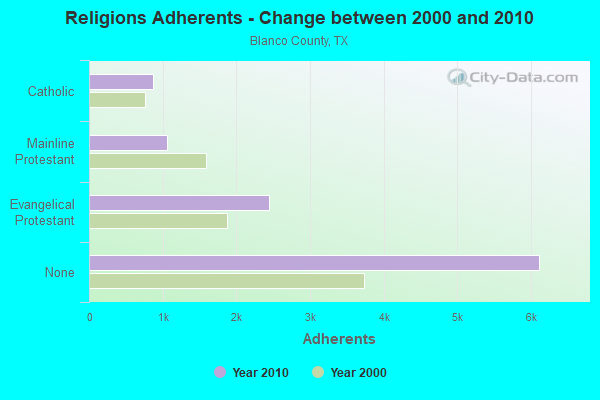
| Religion | Adherents | Congregations |
|---|---|---|
| Evangelical Protestant | 2,447 | 12 |
| Mainline Protestant | 1,055 | 5 |
| Catholic | 872 | 2 |
| Other | 7 | - |
| None | 6,116 | - |
Source: Clifford Grammich, Kirk Hadaway, Richard Houseal, Dale E.Jones, Alexei Krindatch, Richie Stanley and Richard H.Taylor. 2012. 2010 U.S.Religion Census: Religious Congregations & Membership Study. Association of Statisticians of American Religious Bodies. Jones, Dale E., et al. 2002. Congregations and Membership in the United States 2000. Nashville, TN: Glenmary Research Center.
Food Environment Statistics:
| Blanco County: | 2.22 / 10,000 pop. |
| State: | 1.47 / 10,000 pop. |
| This county: | 1.11 / 10,000 pop. |
| Texas: | 1.11 / 10,000 pop. |
| Blanco County: | 8.89 / 10,000 pop. |
| Texas: | 3.95 / 10,000 pop. |
| This county: | 15.55 / 10,000 pop. |
| State: | 6.13 / 10,000 pop. |
| Blanco County: | 9.0% |
| Texas: | 8.9% |
| Blanco County: | 26.8% |
| State: | 26.6% |
Agriculture in Blanco County:
Average size of farms: 497 acresAverage value of agricultural products sold per farm: $15,370
Average value of crops sold per acre for harvested cropland: $640.14
The value of livestock, poultry, and their products as a percentage of the total market value of agricultural products sold: 46.12%
Average total farm production expenses per farm: $21,377
Harvested cropland as a percentage of land in farms: 2.61%
Irrigated harvested cropland as a percentage of land in farms: 4.16%
Average market value of all machinery and equipment per farm: $17,524
The percentage of farms operated by a family or individual: 90.18%
Average age of principal farm operators: 61 years
Average number of cattle and calves per 100 acres of all land in farms: 5.25
Corn for grain: 28 harvested acres
Vegetables: 39 harvested acres
Land in orchards: 299 acres
Tornado activity:
Blanco County historical area-adjusted tornado activity is significantly below Texas state average. It is 3718617.9 times below overall U.S. average.Tornadoes in this county have caused 5 injuries recorded between 1950 and 2004.
On 10/12/2001, a category 3 (max. wind speeds 158-206 mph) tornado injured 5 people and caused $1 million in damages.
Earthquake activity:
Blanco County-area historical earthquake activity is significantly above Texas state average. It is 19% smaller than the overall U.S. average.On 10/20/2011 at 12:24:41, a magnitude 4.8 (4.8 MW, Depth: 3.1 mi, Class: Light, Intensity: IV - V) earthquake occurred 96.9 miles away from Blanco County center
On 4/14/1995 at 00:32:56, a magnitude 5.7 (5.6 MB, 5.7 MS, 5.7 MW, Depth: 11.1 mi, Class: Moderate, Intensity: VI - VII) earthquake occurred 297.8 miles away from the county center
On 6/16/1978 at 11:46:54, a magnitude 5.3 (4.4 MB, 4.6 UK, 5.3 ML) earthquake occurred 238.5 miles away from the county center
On 4/9/1993 at 12:29:19, a magnitude 4.3 (4.1 MB, 4.3 LG, Depth: 3.1 mi) earthquake occurred 100.2 miles away from the county center
On 5/1/2018 at 16:28:56, a magnitude 4.0 (4.0 MW, Depth: 3.1 mi) earthquake occurred 92.4 miles away from Blanco County center
On 5/17/2012 at 08:12:00, a magnitude 4.8 (4.8 MW, Depth: 3.1 mi) earthquake occurred 264.7 miles away from the county center
Magnitude types: regional Lg-wave magnitude (LG), body-wave magnitude (MB), local magnitude (ML), surface-wave magnitude (MS), moment magnitude (MW)
Most recent natural disasters:
- Texas Covid-19 Pandemic, Incident Period: January 20, 2020, FEMA Id: 4485, Natural disaster type: Other
- Texas Severe Storms, Tornadoes, Straight-line Winds, and Flooding, Incident Period: May 04, 2015 to June 23, 2015, Major Disaster (Presidential) Declared DR-4223: May 29, 2015, FEMA Id: 4223, Natural disaster type: Storm, Tornado, Flood, Wind
- Texas Wildfires, Incident Period: March 14, 2008 to September 01, 2008, Emergency Declared EM-3284: March 14, 2008, FEMA Id: 3284, Natural disaster type: Fire
- Texas Hurricane Rita, Incident Period: September 23, 2005 to October 14, 2005, Major Disaster (Presidential) Declared DR-1606: September 24, 2005, FEMA Id: 1606, Natural disaster type: Hurricane
- Texas Hurricane Rita, Incident Period: September 20, 2005 to October 14, 2005, Emergency Declared EM-3261: September 21, 2005, FEMA Id: 3261, Natural disaster type: Hurricane
- Texas Hurricane Katrina, Incident Period: August 29, 2005 to October 01, 2005, Emergency Declared EM-3216: September 02, 2005, FEMA Id: 3216, Natural disaster type: Hurricane
- Texas Severe Storms and Flooding, Incident Period: June 29, 2002 to July 31, 2002, Major Disaster (Presidential) Declared DR-1425: July 04, 2002, FEMA Id: 1425, Natural disaster type: Storm, Flood
- Texas Extreme Fire Hazards, Incident Period: August 01, 1999 to December 10, 1999, Emergency Declared EM-3142: September 01, 1999, FEMA Id: 3142, Natural disaster type: Fire
- Texas Severe Storms, Flooding and Tornadoes, Incident Period: October 17, 1998 to November 15, 1998, Major Disaster (Presidential) Declared DR-1257: October 21, 1998, FEMA Id: 1257, Natural disaster type: Storm, Tornado, Flood
- Texas Severe Storms/Flooding, Incident Period: June 21, 1997 to July 15, 1997, Major Disaster (Presidential) Declared DR-1179: July 07, 1997, FEMA Id: 1179, Natural disaster type: Storm, Flood
- 2 other natural disasters have been reported since 1953.
The number of natural disasters in Blanco County (12) is smaller than the US average (15).
Major Disasters (Presidential) Declared: 6
Emergencies Declared: 5
Causes of natural disasters: Floods: 5, Storms: 5, Fires: 3, Hurricanes: 3, Tornadoes: 3, Wind: 1, Other: 1 (Note: some incidents may be assigned to more than one category).
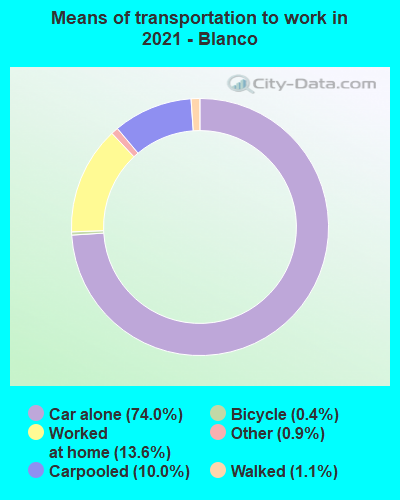
Means of transportation to work:
- Drove a car alone: 3,504 (68.4%)
- Carpooled: 588 (11.5%)
- Bus: 2 (0.0%)
- Taxicab, motorcycle, or other means: 6 (0.1%)
- Bicycle: 29 (0.6%)
- Walked: 81 (1.6%)
- Worked at home: 973 (19.0%)

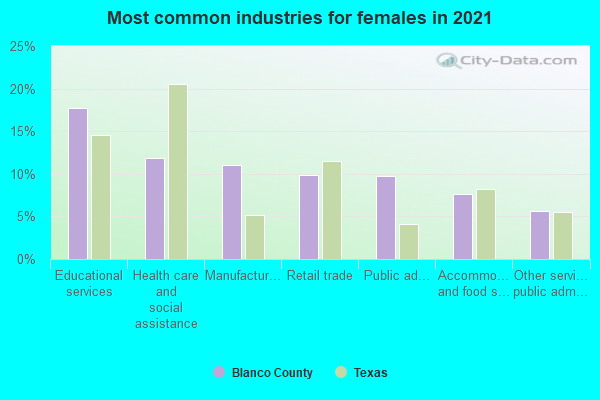
- Retail trade (12%)
- Educational services (11%)
- Health care and social assistance (10%)
- Manufacturing (9%)
- Public administration (7%)
- Accommodation and food services (6%)
- Professional, scientific, and technical services (4%)
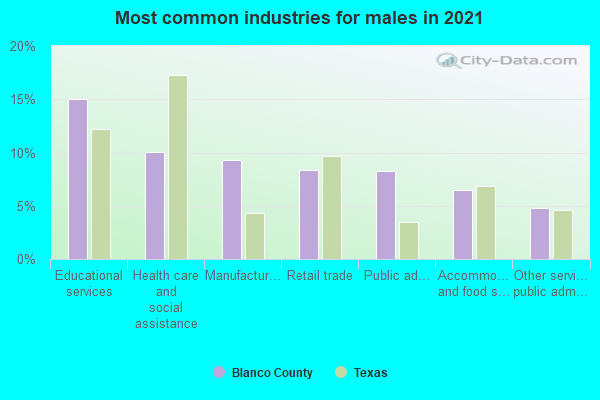
- Retail trade (15%)
- Educational services (13%)
- Health care and social assistance (12%)
- Manufacturing (12%)
- Public administration (9%)
- Accommodation and food services (7%)
- Professional, scientific, and technical services (5%)
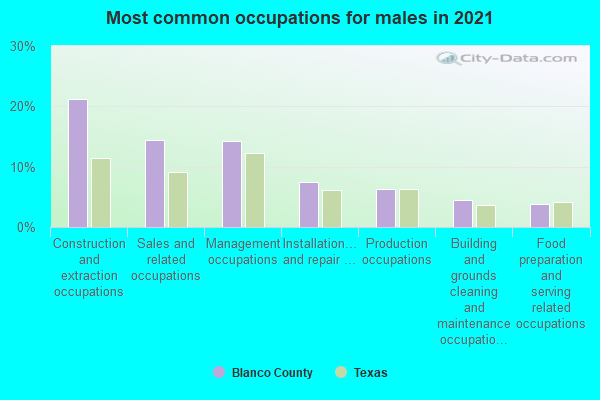
- Construction and extraction occupations (19%)
- Management occupations (17%)
- Sales and related occupations (10%)
- Production occupations (9%)
- Food preparation and serving related occupations (5%)
- Computer and mathematical occupations (5%)
- Educational instruction, and library occupations (4%)
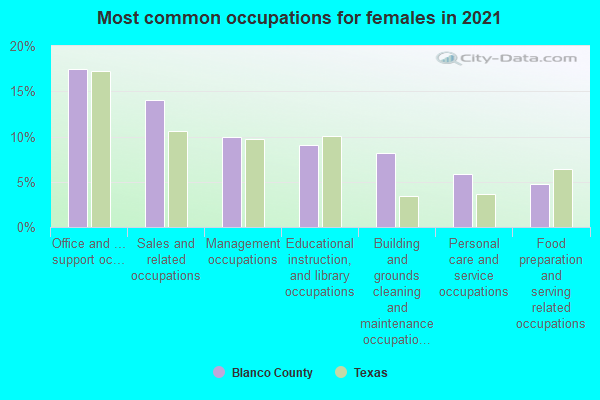
- Office and administrative support occupations (21%)
- Sales and related occupations (16%)
- Management occupations (11%)
- Building and grounds cleaning and maintenance occupations (8%)
- Educational instruction, and library occupations (8%)
- Business and financial operations occupations (6%)
- Personal care and service occupations (5%)
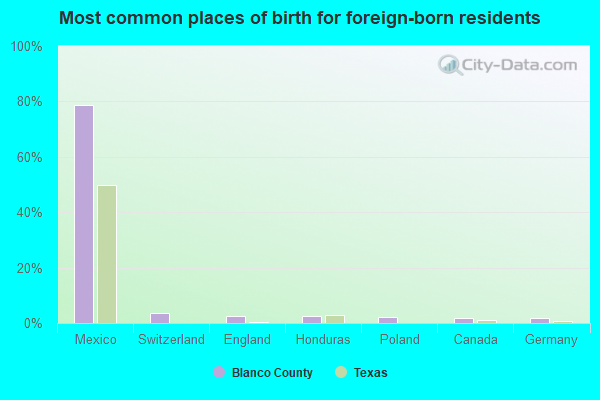
- Mexico (75%)
- England (3%)
- Poland (3%)
- Switzerland (3%)
- Germany (2%)
- Canada (2%)
- Thailand (2%)
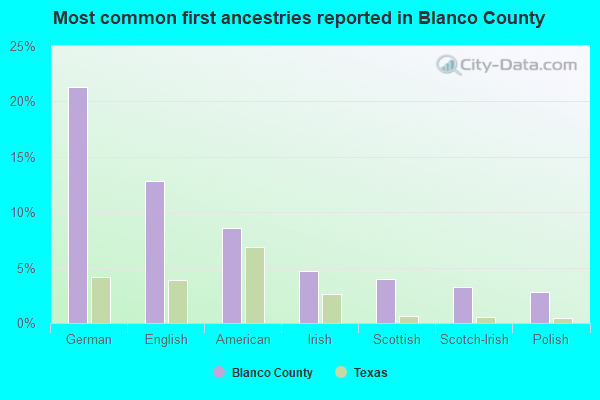
- German (23%)
- English (14%)
- American (9%)
- Irish (4%)
- Scottish (4%)
- Polish (2%)
- Scotch-Irish (2%)
People in group quarters in Blanco County, Texas in 2010:
- 96 people in nursing facilities/skilled-nursing facilities
- 8 people in other noninstitutional facilities
- 2 people in local jails and other municipal confinement facilities
People in group quarters in Blanco County, Texas in 2000:
- 136 people in nursing homes
- 12 people in college dormitories (includes college quarters off campus)
- 4 people in local jails and other confinement facilities (including police lockups)
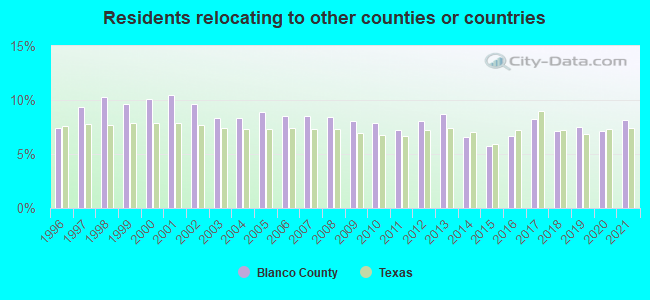
13.75% of this county's 2021 resident taxpayers lived in other counties in 2020 ($107,848 average adjusted gross income)
| Here: | 13.75% |
| Texas average: | 8.12% |
10 or fewer of this county's residents moved from foreign countries.
11.36% relocated from other counties in Texas ($86,818 average AGI)
2.39% relocated from other states ($21,030 average AGI)
Blanco County: 2.39% Texas average: 2.83%

Top counties from which taxpayers relocated into this county between 2020 and 2021:
| from Travis County, TX | |
| from Hays County, TX | |
| from Comal County, TX | |
| from Bexar County, TX | |
| from Harris County, TX | |
| from Williamson County, TX | |
| from Burnet County, TX |
8.18% of this county's 2020 resident taxpayers moved to other counties in 2021 ($77,542 average adjusted gross income)
| Here: | 8.18% |
| Texas average: | 7.40% |
10 or fewer of this county's residents moved to foreign countries.
6.90% relocated to other counties in Texas ($67,694 average AGI)
1.28% relocated to other states ($9,848 average AGI)
Blanco County: 1.28% Texas average: 2.08%
Top counties to which taxpayers relocated from this county between 2020 and 2021:
| to Comal County, TX | |
| to Travis County, TX | |
| to Bexar County, TX | |
| to Burnet County, TX | |
| to Hays County, TX |
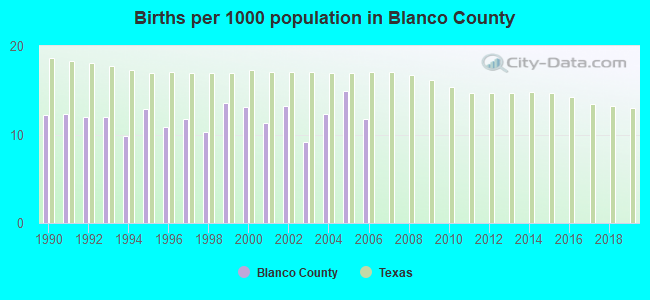
Births per 1000 population from 1990 to 1999: 11.8
Births per 1000 population from 2000 to 2006: 12.2
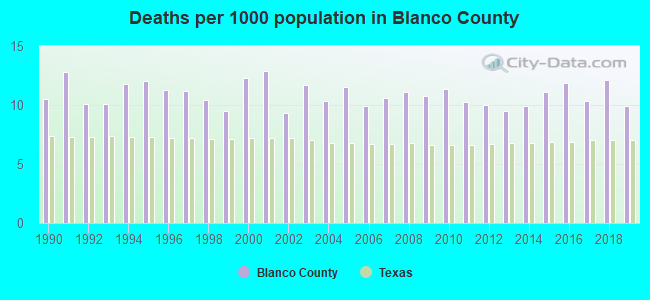
Deaths per 1000 population from 1990 to 1999: 11.0
Deaths per 1000 population from 2000 to 2009: 11.0
Deaths per 1000 population from 2010 to 2020: 10.7
Infant deaths per 1000 live births from 1990 to 1999: 6.0
Infant deaths per 1000 live births from 2000 to 2006: 9.0

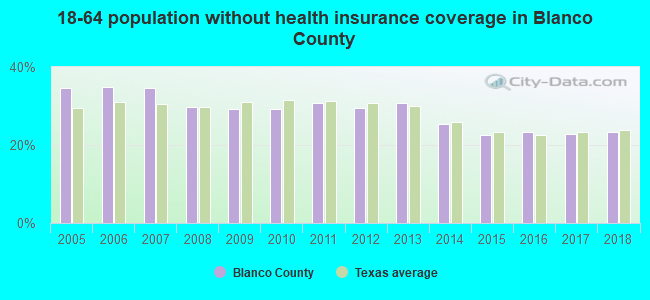
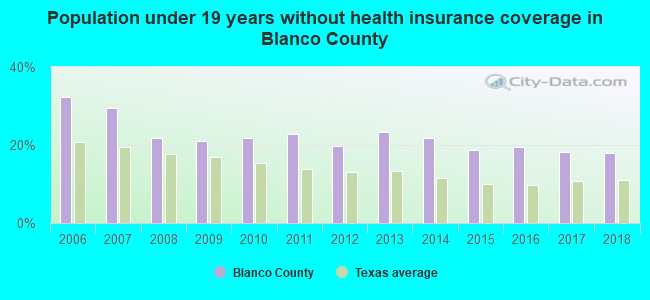
Persons under 19 years old without health insurance coverage in 2018: 17.9%

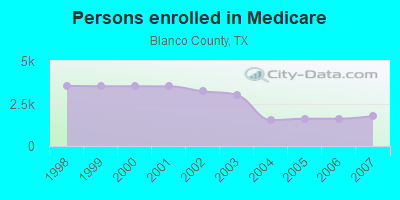
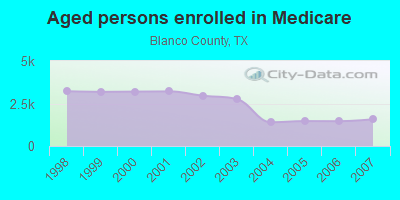
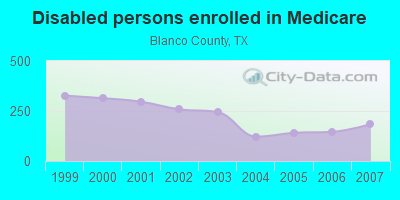
Persons enrolled in hospital insurance and/or supplemental medical insurance (Medicare) in July 1, 2007: 1,754 (1,570 aged, 184 disabled)
Children under 18 without health insurance coverage in 2007: 645 (29%)
Most common underlying causes of death in Blanco County, Texas in 1999 - 2019:
- Stroke, not specified as haemorrhage or infarction (57)
- Acute myocardial infarction, unspecified (49)
- Bronchus or lung, unspecified - Malignant neoplasms (22)
- Atherosclerotic heart disease (12)
- Chronic obstructive pulmonary disease, unspecified (11)
- Heart failure, unspecified (10)
Population without health insurance coverage in 2000: 17%
Children under 18 without health insurance coverage in 2000: 18%
Medical specialist MDs per 100,000 population in 2005: 856
Total births per 100,000 population, July 2005 - July 2006 : 36
Total deaths per 100,000 population, July 2005 - July 2006: 66
Household type by relationship:
Households: 11,920- Male householders: 2,537 (562 living alone), Female householders: 2,574 (744 living alone)
2,909 spouses (2,886 opposite-sex spouses), 338 unmarried partners, (302 opposite-sex unmarried partners), 2,700 children (2,474 natural, 41 adopted, 185 stepchildren), 268 grandchildren, 101 brothers or sisters, 178 parents, 16 foster children, 162 other relatives, 103 non-relatives
- In group quarters: 123
Size of family households: 2,162 2-persons, 415 3-persons, 508 4-persons, 341 5-persons, 40 6-persons, 58 7-or-more-persons.
Size of nonfamily households: 1,307 1-person, 298 2-persons.
1,382 married couples with children.
389 single-parent households (89 men, 300 women).
89.5% of residents of Blanco speak English at home.
8.3% of residents speak Spanish at home (64% speak English very well, 19% speak English well, 6% speak English not well, 10% don't speak English at all).
1.2% of residents speak other Indo-European language at home (100% speak English very well).
1.6% of residents speak Asian or Pacific Island language at home (84% speak English very well, 16% speak English well).
In fiscal year 2004:
Federal Government expenditure: $68,242,000 ($7,498 per capita)
Department of Defense expenditure: $3,521,000
Federal direct payments to individuals for retirement and disability: $42,426,000
Federal other direct payments to individuals: $18,206,000
Federal direct payments not to individuals: $124,000
Federal grants: $3,492,000
Federal procurement contracts: $377,000 ($4,000 Department of Defense)
Federal salaries and wages: $3,617,000 ($0,000 Department of Defense)
Federal Government direct loans: $200,000
Federal guaranteed/insured loans: $1,968,000
Federal Government insurance: $7,868,000
Population change from April 1, 2000 to July 1, 2005:
Births: 485| Here: | 53 per 1000 residents |
| State: | 85 per 1000 residents |
Deaths: 531
| Here: | 58 per 1000 residents |
| State: | 35 per 1000 residents |
Net international migration: +75
| Here: | +8 per 1000 residents |
| State: | +29 per 1000 residents |
Net internal migration: +697
| Here: | +77 per 1000 residents |
| State: | +10 per 1000 residents |
Total withdrawal of fresh water for public supply: 0.73 millions of gallons per day (55% from ground, 45% from surface)
| Here: | 6.1 |
| State: | 6.3 |
| Here: | 4.1 |
| State: | 4.0 |
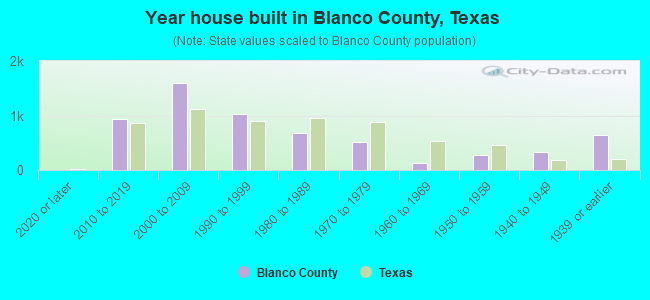
- Year house built in Blanco County, Texas
- 992020 or later
- 1,1662010 to 2019
- 1,5582000 to 2009
- 9451990 to 1999
- 6111980 to 1989
- 4701970 to 1979
- 1451960 to 1969
- 2821950 to 1959
- 3051940 to 1949
- 6041939 or earlier
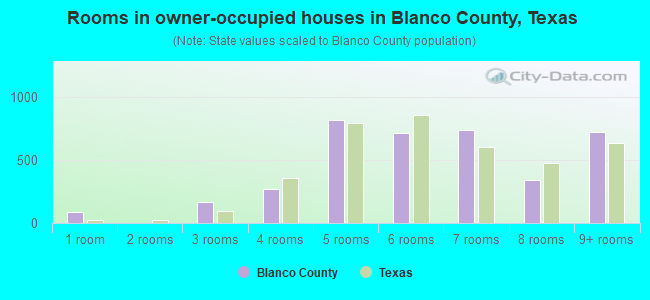
- Rooms in owner-occupied houses in Blanco County, Texas
- 241 room
- 232 rooms
- 2973 rooms
- 3364 rooms
- 9475 rooms
- 6166 rooms
- 7537 rooms
- 3498 rooms
- 6589+ rooms
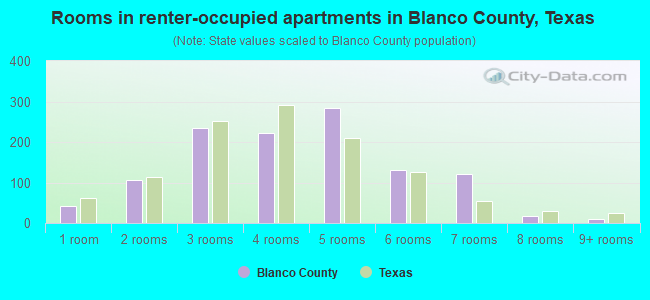
- Rooms in renter-occupied apartments in Blanco County, Texas
- 391 room
- 1062 rooms
- 2433 rooms
- 2644 rooms
- 2455 rooms
- 896 rooms
- 977 rooms
- 68 rooms
- 229+ rooms
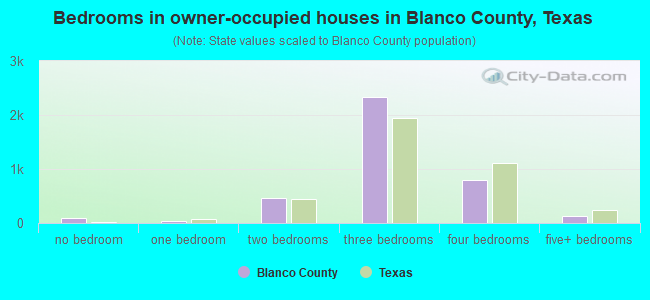
- Bedrooms in owner-occupied houses in Blanco County, Texas
- 34no bedroom
- 891 bedroom
- 5702 bedrooms
- 2,2633 bedrooms
- 8534 bedrooms
- 1735+ bedrooms
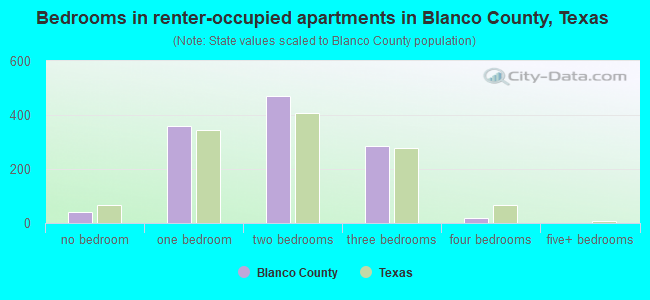
- Bedrooms in renter-occupied apartments in Blanco County, Texas
- 56no bedroom
- 3421 bedroom
- 3962 bedrooms
- 3013 bedrooms
- 204 bedrooms
- 05+ bedrooms
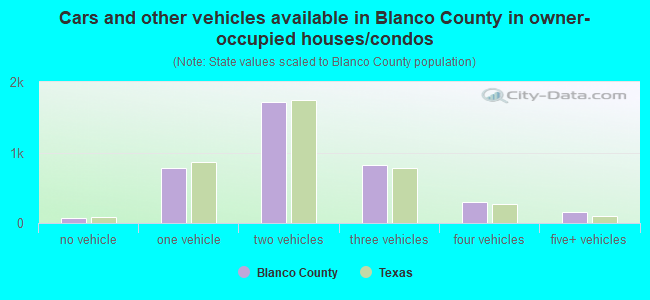
- Cars and other vehicles available in Blanco County in owner-occupied houses/condos
- 46no vehicle
- 9261 vehicle
- 1,5572 vehicles
- 9633 vehicles
- 3104 vehicles
- 1825+ vehicles
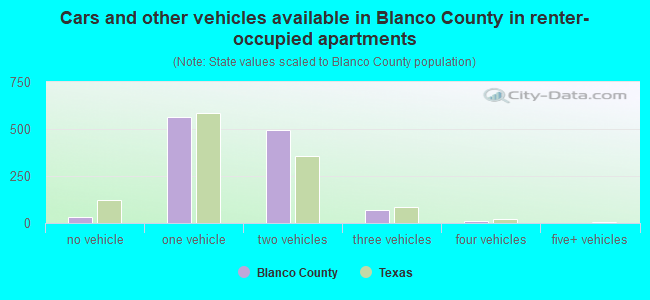
- Cars and other vehicles available in Blanco County in renter-occupied apartments
- 48no vehicle
- 5791 vehicle
- 4282 vehicles
- 573 vehicles
- 74 vehicles
- 05+ vehicles
90.4% of Blanco County residents lived in the same house 1 years ago.
Out of people who lived in different houses, 21% lived in this county.
Out of people who lived in different counties, 73% lived in Texas.
| Blanco County: | 90.4% |
| State average: | 85.7% |
Place of birth for U.S.-born residents:
- This state: 7,764
- Other state: 3,041
- Northeast: 395
- Midwest: 1,027
- South: 815
- West: 800

- 77.9%Electricity
- 17.7%Bottled, tank, or LP gas
- 2.5%Utility gas
- 1.6%Wood
- 0.2%Other fuel
- 0.2%No fuel used
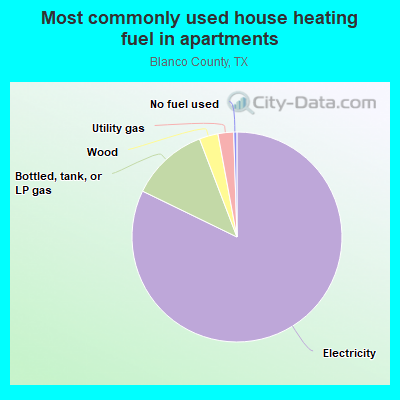
- 82.4%Electricity
- 12.1%Bottled, tank, or LP gas
- 2.5%Utility gas
- 2.5%Wood
- 0.4%No fuel used
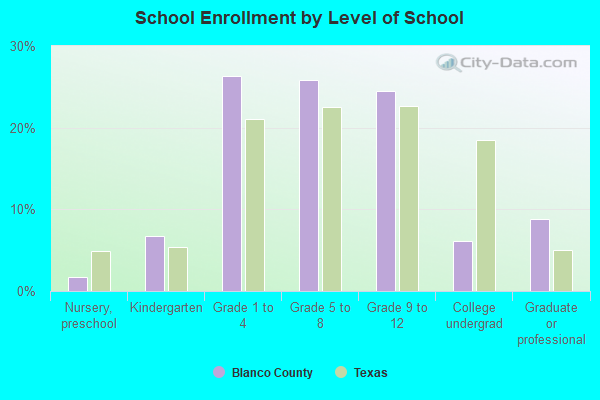
Private vs. public school enrollment:
| Here: | 6.0% |
| Texas: | 8.8% |
| Here: | 4.8% |
| Texas: | 8.0% |
| Here: | 7.1% |
| Texas: | 16.2% |

Blanco County government finances - Expenditure in 2018:
- Charges - Other: $538,000
- Construction - Regular Highways: $63,000
- Current Operations - Police Protection: $2,341,000
Judicial and Legal Services: $1,236,000
Regular Highways: $867,000
Central Staff Services: $675,000
Financial Administration: $500,000
Public Welfare, Vendor Payments for Medical Care: $237,000
General Public Buildings: $227,000
Natural Resources - Other: $99,000
Protective Inspection and Regulation - Other: $89,000
Corrections - Other: $62,000
Parks and Recreation: $12,000
General - Other: $1,000
- General - Interest on Debt: $246,000
- Long Term Debt - Beginning Outstanding - Unspecified Public Purpose: $6,230,000
Outstanding Unspecified Public Purpose: $5,895,000
Retired Unspecified Public Purpose: $335,000
- Miscellaneous - Fines and Forfeits: $195,000
General Revenue - Other: $55,000
Rents: $23,000
Donations From Private Sources: $6,000
Interest Earnings: $4,000
- Other Capital Outlay - Central Staff Services: $101,000
Regular Highways: $53,000
- Other Funds - Cash and Securities: $4,624,000
- State Intergovernmental - Other: $104,000
Highways: $18,000
- Tax - Property: $4,590,000
Other License: $544,000
General Sales and Gross Receipts: $501,000
Other: $13,000
- Total Salaries and Wages: $3,346,000
Blanco County government finances - Revenue in 2018:
- Charges - Other: $538,000
- Construction - Regular Highways: $63,000
- Current Operations - Police Protection: $2,341,000
Judicial and Legal Services: $1,236,000
Regular Highways: $867,000
Central Staff Services: $675,000
Financial Administration: $500,000
Public Welfare, Vendor Payments for Medical Care: $237,000
General Public Buildings: $227,000
Natural Resources - Other: $99,000
Protective Inspection and Regulation - Other: $89,000
Corrections - Other: $62,000
Parks and Recreation: $12,000
General - Other: $1,000
- General - Interest on Debt: $246,000
- Long Term Debt - Beginning Outstanding - Unspecified Public Purpose: $6,230,000
Outstanding Unspecified Public Purpose: $5,895,000
Retired Unspecified Public Purpose: $335,000
- Miscellaneous - Fines and Forfeits: $195,000
General Revenue - Other: $55,000
Rents: $23,000
Donations From Private Sources: $6,000
Interest Earnings: $4,000
- Other Capital Outlay - Central Staff Services: $101,000
Regular Highways: $53,000
- Other Funds - Cash and Securities: $4,624,000
- State Intergovernmental - Other: $104,000
Highways: $18,000
- Tax - Property: $4,590,000
Other License: $544,000
General Sales and Gross Receipts: $501,000
Other: $13,000
- Total Salaries and Wages: $3,346,000
Blanco County government finances - Debt in 2018:
- Charges - Other: $538,000
- Construction - Regular Highways: $63,000
- Current Operations - Police Protection: $2,341,000
Judicial and Legal Services: $1,236,000
Regular Highways: $867,000
Central Staff Services: $675,000
Financial Administration: $500,000
Public Welfare, Vendor Payments for Medical Care: $237,000
General Public Buildings: $227,000
Natural Resources - Other: $99,000
Protective Inspection and Regulation - Other: $89,000
Corrections - Other: $62,000
Parks and Recreation: $12,000
General - Other: $1,000
- General - Interest on Debt: $246,000
- Long Term Debt - Beginning Outstanding - Unspecified Public Purpose: $6,230,000
Outstanding Unspecified Public Purpose: $5,895,000
Retired Unspecified Public Purpose: $335,000
- Miscellaneous - Fines and Forfeits: $195,000
General Revenue - Other: $55,000
Rents: $23,000
Donations From Private Sources: $6,000
Interest Earnings: $4,000
- Other Capital Outlay - Central Staff Services: $101,000
Regular Highways: $53,000
- Other Funds - Cash and Securities: $4,624,000
- State Intergovernmental - Other: $104,000
Highways: $18,000
- Tax - Property: $4,590,000
Other License: $544,000
General Sales and Gross Receipts: $501,000
Other: $13,000
- Total Salaries and Wages: $3,346,000
Blanco County government finances - Cash and Securities in 2018:
- Charges - Other: $538,000
- Construction - Regular Highways: $63,000
- Current Operations - Police Protection: $2,341,000
Judicial and Legal Services: $1,236,000
Regular Highways: $867,000
Central Staff Services: $675,000
Financial Administration: $500,000
Public Welfare, Vendor Payments for Medical Care: $237,000
General Public Buildings: $227,000
Natural Resources - Other: $99,000
Protective Inspection and Regulation - Other: $89,000
Corrections - Other: $62,000
Parks and Recreation: $12,000
General - Other: $1,000
- General - Interest on Debt: $246,000
- Long Term Debt - Beginning Outstanding - Unspecified Public Purpose: $6,230,000
Outstanding Unspecified Public Purpose: $5,895,000
Retired Unspecified Public Purpose: $335,000
- Miscellaneous - Fines and Forfeits: $195,000
General Revenue - Other: $55,000
Rents: $23,000
Donations From Private Sources: $6,000
Interest Earnings: $4,000
- Other Capital Outlay - Central Staff Services: $101,000
Regular Highways: $53,000
- Other Funds - Cash and Securities: $4,624,000
- State Intergovernmental - Other: $104,000
Highways: $18,000
- Tax - Property: $4,590,000
Other License: $544,000
General Sales and Gross Receipts: $501,000
Other: $13,000
- Total Salaries and Wages: $3,346,000
Supplemental Security Income (SSI) in 2006:
- Total number of recipients: 87
- Number of aged recipients: 23
- Number of blind and disabled recipients: 64
- Number of recipients under 18: 11
- Number of recipients between 18 and 64: 43
- Number of recipients older than 64: 33
- Number of recipients also receiving OASDI: 47
- Amount of payments (thousands of dollars): 26
| Most common first names in Blanco County, TX among deceased individuals | ||
| Name | Count | Lived (average) |
|---|---|---|
| John | 53 | 72.5 years |
| James | 52 | 71.9 years |
| Mary | 48 | 79.9 years |
| William | 43 | 77.1 years |
| Robert | 36 | 73.0 years |
| Charles | 26 | 75.5 years |
| Henry | 20 | 78.6 years |
| George | 18 | 77.8 years |
| Margaret | 17 | 80.5 years |
| Annie | 17 | 83.6 years |
| Most common last names in Blanco County, TX among deceased individuals | ||
| Last name | Count | Lived (average) |
|---|---|---|
| Smith | 46 | 81.0 years |
| Sultemeier | 19 | 72.0 years |
| Wagner | 18 | 78.4 years |
| Johnson | 16 | 74.2 years |
| Jones | 16 | 77.4 years |
| Wood | 16 | 72.3 years |
| Casparis | 15 | 78.9 years |
| Schmidt | 13 | 82.8 years |
| Stevenson | 12 | 80.2 years |
| Cox | 12 | 79.5 years |
| Businesses in Blanco County, TX | ||||
| Name | Count | Name | Count | |
|---|---|---|---|---|
| Best Western | 2 | SONIC Drive-In | 1 | |
| Dairy Queen | 1 | Sears | 1 | |
| FedEx | 2 | Subway | 2 | |
| H&R Block | 1 | U-Haul | 2 | |