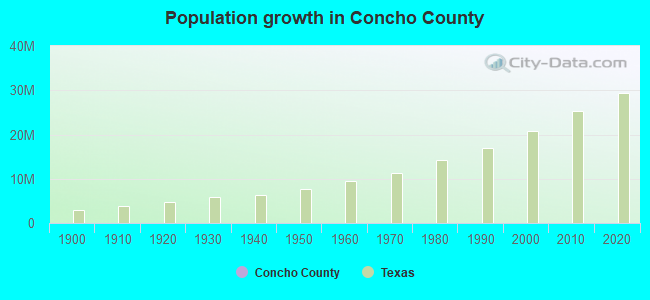
Concho County, Texas (TX)
County owner-occupied free and clear houses and condos in 2010: 497
County owner-occupied houses and condos in 2000: 794
Renter-occupied apartments: 255 (it was 264 in 2000)
| % of renters here: | 25% |
| State: | 36% |
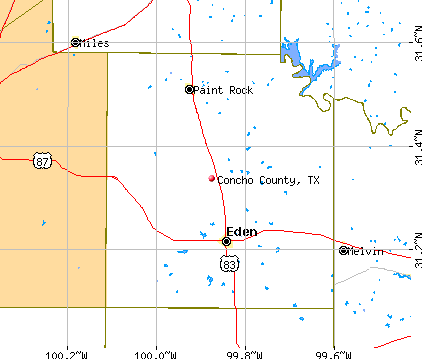
Land area: 991 sq. mi.
Water area: 2.2 sq. mi.
Population density: 3 people per square mile (very low).
Industries providing employment: Educational, health and social services (33.6%), Retail trade (26.9%).
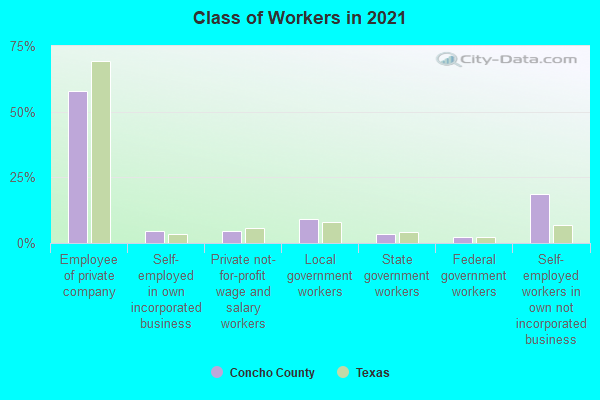
Type of workers:
- Private wage or salary: 76%
- Government: 13%
- Self-employed, not incorporated: 10%
- Unpaid family work: 0%
- OSM Map
- General Map
- Google Map
- MSN Map

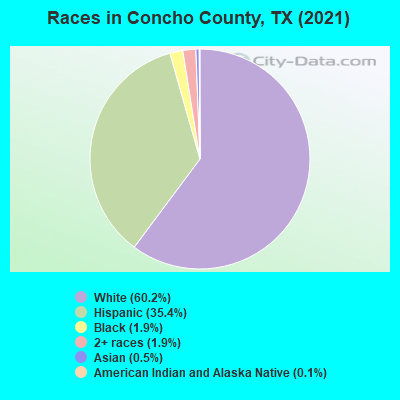
- 1,74453.0%White Non-Hispanic Alone
- 1,29739.4%Hispanic or Latino
- 1384.2%Black Non-Hispanic Alone
- 722.2%Two or more races
- 300.9%Asian alone
- 80.2%Some other race alone
- 10.03%American Indian and Alaska Native alone
| Median resident age: | 46.9 years |
| Texas median age: | 35.6 years |
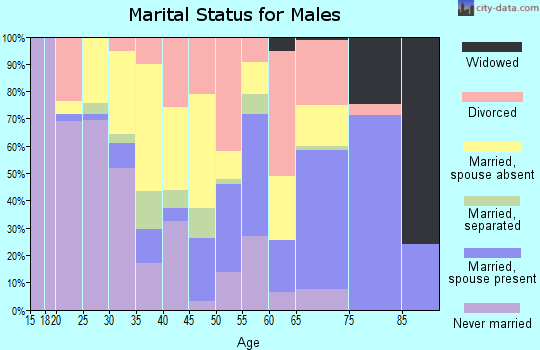
| Males: 1,841 | |
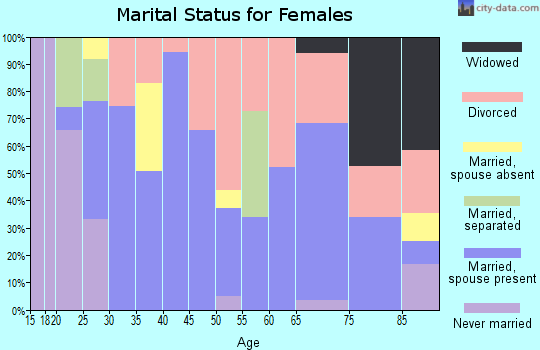
| Females: 1,480 |

 | New County Population Estimates from the Census Bureau for Jluy 1, 2016 posted this morning about 9 A. M. (13 replies) |
| Texas Trivia (1626 replies) |
| Thinking about transferring to Tech or ASU (4 replies) |
| Concho County: | 2.0 people |
| Texas: | 3 people |
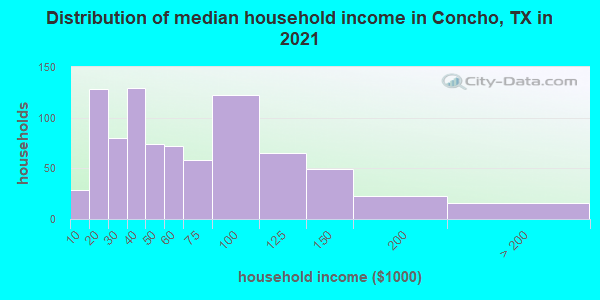
Estimated median household income in 2022: $55,176 ($31,312 in 1999)
| This county: | $55,176 |
| Texas: | $72,284 |
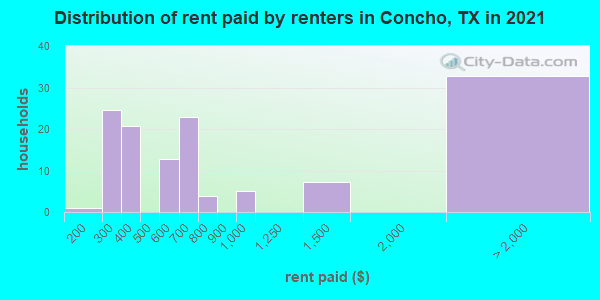
Median contract rent in 2022 for apartments: $462 (lower quartile is $299, upper quartile is $758)
| This county: | $462 |
| State: | $1117 |
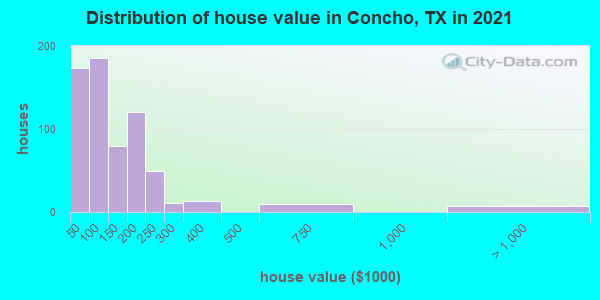
Estimated median house or condo value in 2022: $107,499 (it was $47,600 in 2000)
| Concho: | $107,499 |
| Texas: | $275,400 |
Mean price in 2022:
Median monthly housing costs for homes and condos with a mortgage: $1,139Detached houses: $231,179
Here: $231,179 State: $369,058 Townhouses or other attached units: $375,439
Here: $375,439 State: $327,631 Mobile homes: $101,693
Here: $101,693 State: $124,413
Median monthly housing costs for units without a mortgage: $482
Institutionalized population: 1,588
Crime in 2021 (reported by the sheriff's office or county police, not the county total):
- Murders: 0
- Rapes: 0
- Robberies: 0
- Assaults: 5
- Burglaries: 2
- Thefts: 1
- Auto thefts: 0
Crime in 2020 (reported by the sheriff's office or county police, not the county total):
- Murders: 0
- Rapes: 0
- Robberies: 0
- Assaults: 1
- Burglaries: 2
- Thefts: 5
- Auto thefts: 1
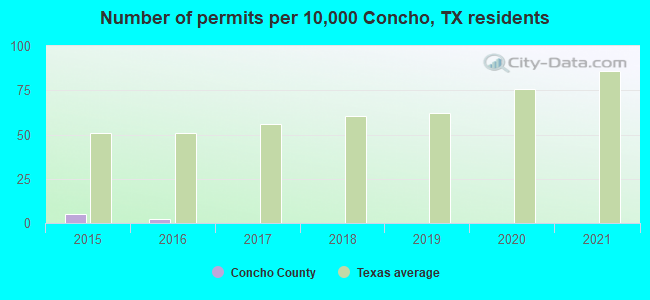
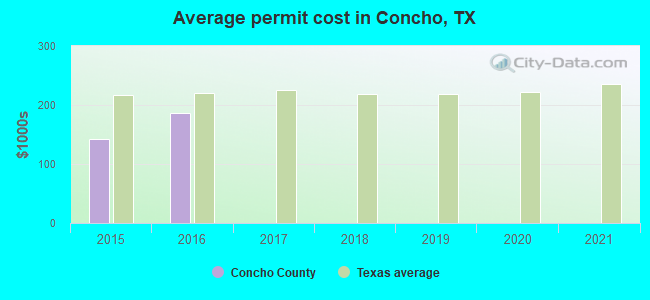
Single-family new house construction building permits:
- 2022: 0 buildings
- 2021: 0 buildings
- 2020: 0 buildings
- 2019: 0 buildings
- 2018: 0 buildings
- 2017: 0 buildings
- 2016: 1 building, cost: $186,000
- 2015: 2 buildings, average cost: $142,500
Median real estate property taxes paid for housing units with mortgages in 2022: $2,313 (1.9%)
Median real estate property taxes paid for housing units with no mortgage in 2022: $1,238 (1.2%)
| Concho County: | 15.9% |
| Texas: | 14.0% |
Median age of residents in 2022: 46.9 years old
(Males: 43.3 years old, Females: 53.9 years old)
(Median age for: White residents: 53.7 years old, Black residents: 40.4 years old, Asian residents: 38.7 years old, Hispanic or Latino residents: 42.7 years old, Other race residents: 37.6 years old)
Fair market rent in 2006 for a 1-bedroom apartment in Concho County is $401 a month.
Fair market rent for a 2-bedroom apartment is $484 a month.
Fair market rent for a 3-bedroom apartment is $624 a month.
Cities in this county include: Eden-Millersview, Eden, Eola-Paint Rock, Paint Rock.
Neighboring counties: Berrien County, Georgia  , Monroe County, Alabama , Coryell County , Wilkinson County, Mississippi , Terrell County, Georgia .
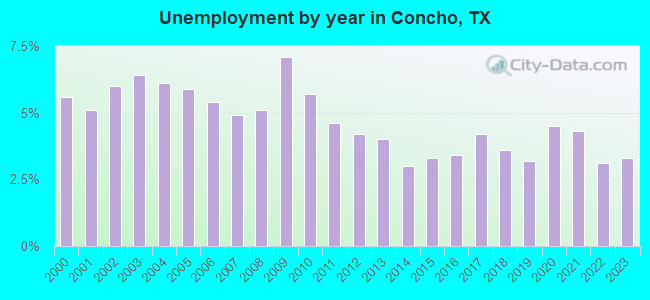
| Here: | 2.9% |
| Texas: | 3.5% |
Current college students: 144
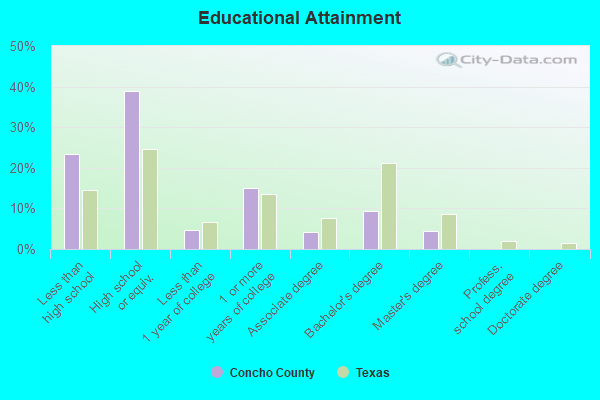
People 25 years of age or older with a high school degree or higher: 74.9%
People 25 years of age or older with a bachelor's degree or higher: 11.6%
Number of foreign born residents: 380 (14.2% naturalized citizens)
| Concho County: | 11.4% |
| Whole state: | 17.2% |

- Year of entry for the foreign-born population
- 1672010 or later
- 632000 to 2009
- 481990 to 1999
- 241980 to 1989
- 311970 to 1979
- 39Before 1970
Mean travel time to work (commute): minutes
Percentage of county residents living and working in this county: 100.1%
Housing units in structures:
- One, detached: 1,119
- One, attached: 4
- Two: 11
- 5 to 9: 1
- 50 or more: 12
- Mobile homes: 312
- Boats, RVs, vans, etc.: 4
Housing units in Concho County with a mortgage: 204 (3 second mortgage, 0 home equity loan, 4 both second mortgage and home equity loan)
Houses without a mortgage: 1
| Here: | 99.5% with mortgage |
| State: | 98.4% with mortgage |
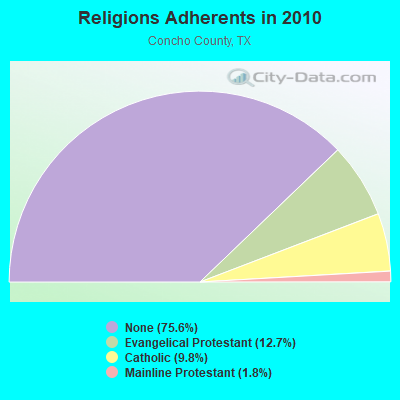
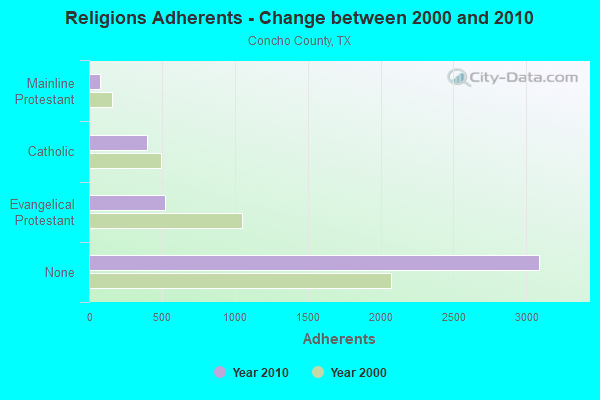
Religion statistics for Concho County
| Religion | Adherents | Congregations |
|---|---|---|
| Evangelical Protestant | 521 | 10 |
| Catholic | 400 | 3 |
| Mainline Protestant | 75 | 2 |
| Other | 1 | - |
| None | 3,090 | - |
Source: Clifford Grammich, Kirk Hadaway, Richard Houseal, Dale E.Jones, Alexei Krindatch, Richie Stanley and Richard H.Taylor. 2012. 2010 U.S.Religion Census: Religious Congregations & Membership Study. Association of Statisticians of American Religious Bodies. Jones, Dale E., et al. 2002. Congregations and Membership in the United States 2000. Nashville, TN: Glenmary Research Center.
Food Environment Statistics:
| Concho County: | 2.79 / 10,000 pop. |
| State: | 1.47 / 10,000 pop. |
| Concho County: | 16.72 / 10,000 pop. |
| Texas: | 3.95 / 10,000 pop. |
| This county: | 5.57 / 10,000 pop. |
| State: | 6.13 / 10,000 pop. |
| Concho County: | 8.3% |
| Texas: | 8.9% |
| Concho County: | 28.1% |
| State: | 26.6% |
Agriculture in Concho County:
Average size of farms: 1324 acresAverage value of agricultural products sold per farm: $34,815
Average value of crops sold per acre for harvested cropland: $86.25
The value of nursery, greenhouse, floriculture, and sod as a percentage of the total market value of agricultural products sold: 0.00%
The value of livestock, poultry, and their products as a percentage of the total market value of agricultural products sold: 52.02%
Average total farm production expenses per farm: $41,882
Harvested cropland as a percentage of land in farms: 14.62%
Irrigated harvested cropland as a percentage of land in farms: 5.36%
Average market value of all machinery and equipment per farm: $53,269
The percentage of farms operated by a family or individual: 86.13%
Average age of principal farm operators: 57 years
Average number of cattle and calves per 100 acres of all land in farms: 3.15
All wheat for grain: 30381 harvested acres
Upland cotton: 32077 harvested acres
Land in orchards: 18 acres
Earthquake activity:
Concho County-area historical earthquake activity is significantly above Texas state average. It is 287% greater than the overall U.S. average.On 6/16/1978 at 11:46:54, a magnitude 5.3 (4.4 MB, 4.6 UK, 5.3 ML, Class: Moderate, Intensity: VI - VII) earthquake occurred 128.2 miles away from Concho County center
On 4/14/1995 at 00:32:56, a magnitude 5.7 (5.6 MB, 5.7 MS, 5.7 MW, Depth: 11.1 mi) earthquake occurred 219.8 miles away from the county center
On 1/2/1992 at 11:45:35, a magnitude 5.0 (4.6 MB, 5.0 LG, Depth: 3.1 mi) earthquake occurred 201.6 miles away from the county center
On 11/6/2011 at 03:53:10, a magnitude 5.7 (5.7 MW, Depth: 3.2 mi) earthquake occurred 341.3 miles away from the county center
On 10/20/2011 at 12:24:41, a magnitude 4.8 (4.8 MW, Depth: 3.1 mi, Class: Light, Intensity: IV - V) earthquake occurred 201.9 miles away from Concho County center
On 3/26/2020 at 15:16:27, a magnitude 5.0 (5.0 MW, Depth: 5.9 mi) earthquake occurred 246.9 miles away from the county center
Magnitude types: regional Lg-wave magnitude (LG), body-wave magnitude (MB), local magnitude (ML), surface-wave magnitude (MS), moment magnitude (MW)
Most recent natural disasters:
- Texas Covid-19 Pandemic, Incident Period: January 20, 2020, FEMA Id: 4485, Natural disaster type: Other
- Texas Wildfires, Incident Period: March 14, 2008 to September 01, 2008, Emergency Declared EM-3284: March 14, 2008, FEMA Id: 3284, Natural disaster type: Fire
- Texas Hurricane Rita, Incident Period: September 23, 2005 to October 14, 2005, Major Disaster (Presidential) Declared DR-1606: September 24, 2005, FEMA Id: 1606, Natural disaster type: Hurricane
- Texas Hurricane Rita, Incident Period: September 20, 2005 to October 14, 2005, Emergency Declared EM-3261: September 21, 2005, FEMA Id: 3261, Natural disaster type: Hurricane
- Texas Hurricane Katrina, Incident Period: August 29, 2005 to October 01, 2005, Emergency Declared EM-3216: September 02, 2005, FEMA Id: 3216, Natural disaster type: Hurricane
- Texas Extreme Fire Hazards, Incident Period: August 01, 1999 to December 10, 1999, Emergency Declared EM-3142: September 01, 1999, FEMA Id: 3142, Natural disaster type: Fire
- Texas Extreme Fire Hazard, Incident Period: August 30, 1993 to November 15, 1993, Emergency Declared EM-3113: September 10, 1993, FEMA Id: 3113, Natural disaster type: Fire
The number of natural disasters in Concho County (7) is smaller than the US average (15).
Major Disasters (Presidential) Declared: 1
Emergencies Declared: 5
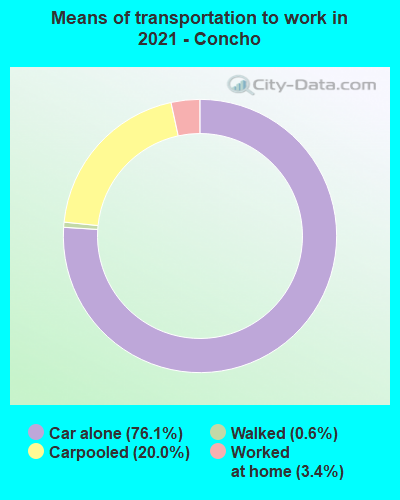
Means of transportation to work:
- Drove a car alone: 1,015 (73.4%)
- Carpooled: 246 (17.8%)
- Walked: 28 (2.0%)
- Worked at home: 58 (4.2%)
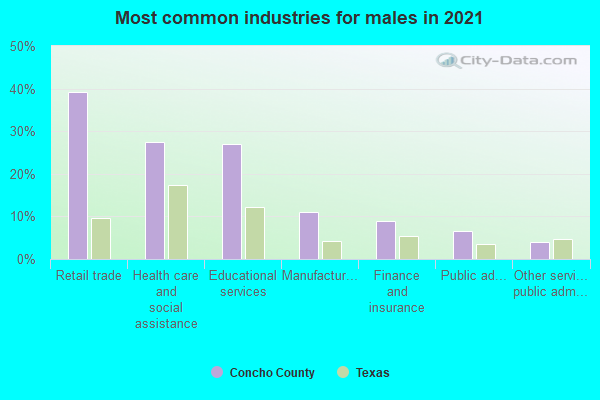
- Retail trade (66%)
- Health care and social assistance (57%)
- Educational services (31%)
- Manufacturing (13%)
- Public administration (7%)
- Finance and insurance (6%)
- Accommodation and food services (5%)
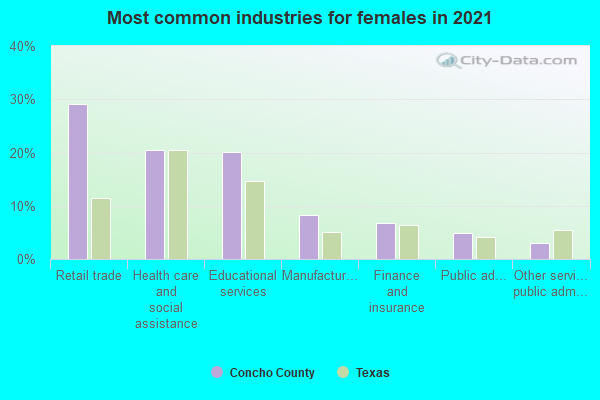
- Retail trade (33%)
- Health care and social assistance (29%)
- Educational services (16%)
- Manufacturing (7%)
- Public administration (3%)
- Finance and insurance (3%)
- Accommodation and food services (2%)
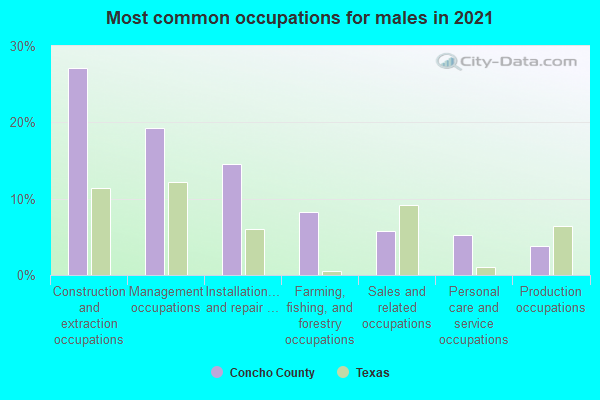
- Construction and extraction occupations (23%)
- Management occupations (18%)
- Farming, fishing, and forestry occupations (11%)
- Sales and related occupations (9%)
- Personal care and service occupations (6%)
- Production occupations (6%)
- Material moving occupations (4%)
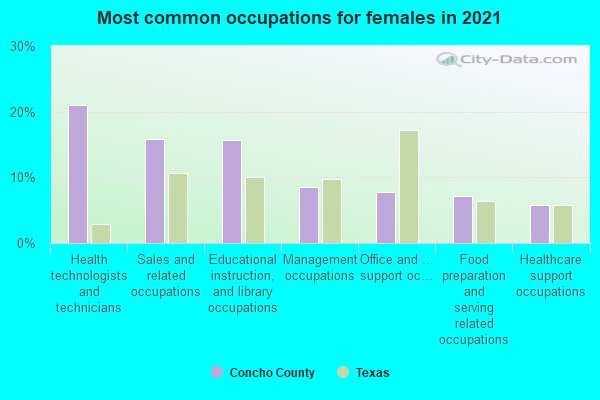
- Health technologists and technicians (28%)
- Educational instruction, and library occupations (12%)
- Sales and related occupations (12%)
- Healthcare support occupations (10%)
- Management occupations (8%)
- Health diagnosing and treating practitioners and other technical occupations (6%)
- Food preparation and serving related occupations (6%)
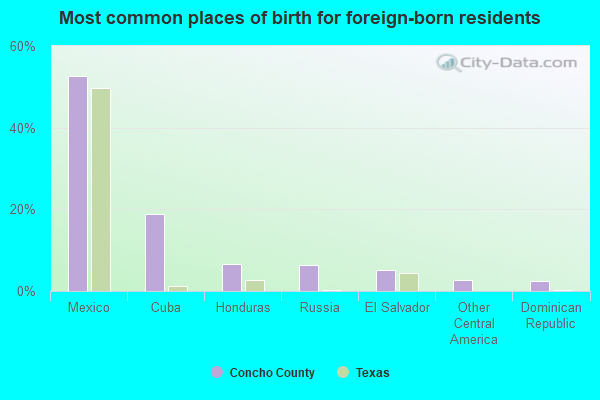
- Mexico (53%)
- Cuba (21%)
- Russia (8%)
- El Salvador (5%)
- Thailand (5%)
- Other Central America (4%)
- Honduras (3%)
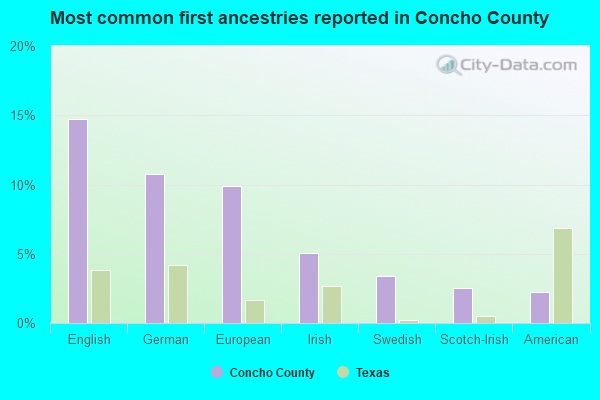
- German (13%)
- European (9%)
- English (6%)
- Irish (4%)
- Scotch-Irish (3%)
- American (2%)
- Russian (1%)
32 people in nursing facilities/skilled-nursing facilities
1,299 people in federal prisons and detention centers
71 people in nursing homes
9.56% of this county's 2021 resident taxpayers lived in other counties in 2020 ($52,365 average adjusted gross income)
| Here: | 9.56% |
| Texas average: | 8.12% |
10 or fewer of this county's residents moved from foreign countries.
9.56% relocated from other counties in Texas ($52,365 average AGI)
10 or fewer of this county's residents relocated from other states.
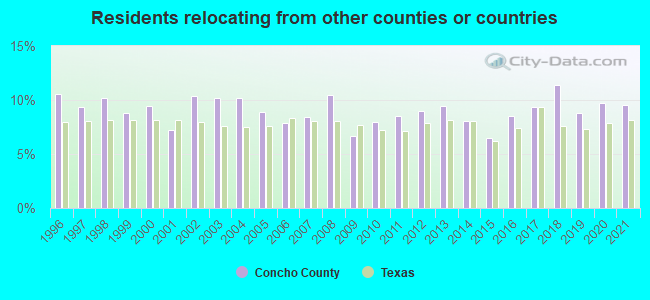
Top counties from which taxpayers relocated into this county between 2020 and 2021:
| from Tom Green County, TX |
7.37% of this county's 2020 resident taxpayers moved to other counties in 2021 ($52,266 average adjusted gross income)
| Here: | 7.37% |
| Texas average: | 7.40% |
10 or fewer of this county's residents moved to foreign countries.
7.37% relocated to other counties in Texas ($52,266 average AGI)
10 or fewer of this county's residents relocated to other states.
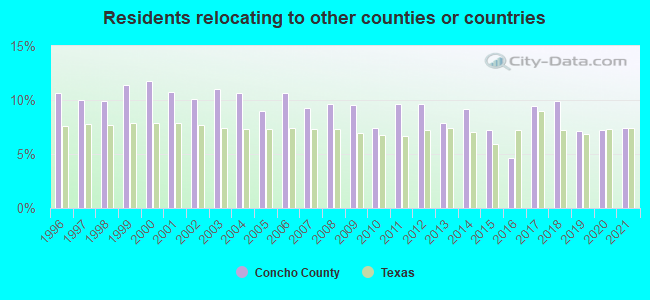
Top counties to which taxpayers relocated from this county between 2020 and 2021:
| to Tom Green County, TX |
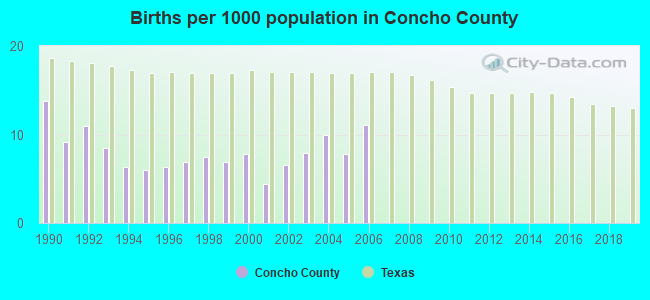
Births per 1000 population from 1990 to 1999: 8.2
Births per 1000 population from 2000 to 2006: 7.9
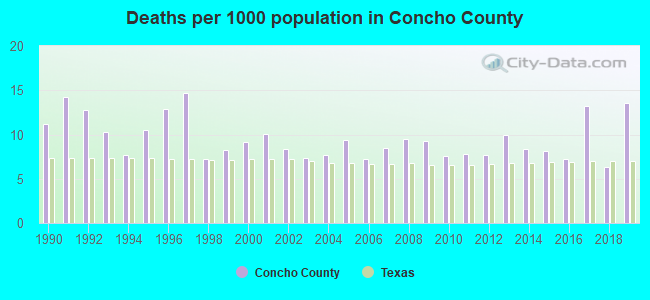
Deaths per 1000 population from 1990 to 1999: 11.0
Deaths per 1000 population from 2000 to 2009: 8.7
Deaths per 1000 population from 2010 to 2020: 9.3
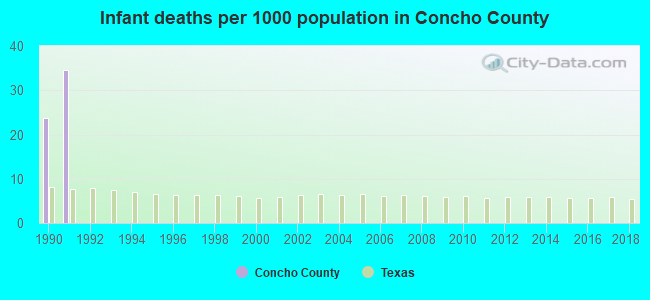
Infant deaths per 1000 live births from 1990 to 1999: 5.8
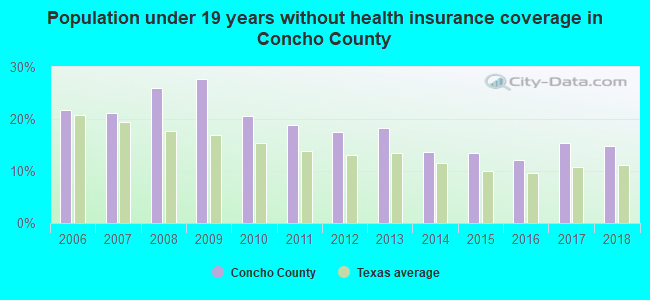
Persons under 19 years old without health insurance coverage in 2018: 14.8%

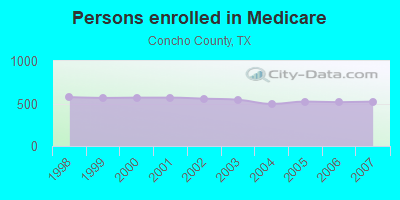
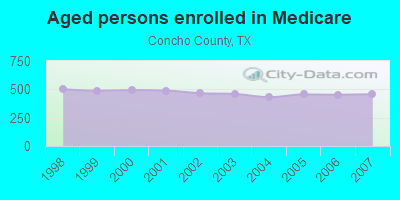
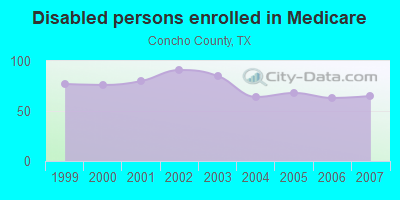
Persons enrolled in hospital insurance and/or supplemental medical insurance (Medicare) in July 1, 2007: 522 (457 aged, 65 disabled)
Children under 18 without health insurance coverage in 2007: 98 (20%)
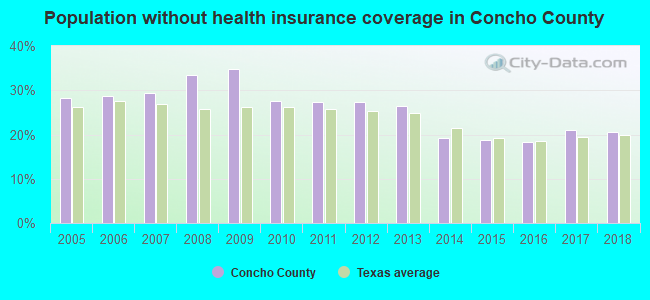
Population without health insurance coverage in 2000: 22%
Children under 18 without health insurance coverage in 2000: 24%
Short term general hospital admissions per 100,000 population in 2004: 4,327
Short term general hospital beds per 100,000 population in 2004: 427
Emergency room visits per 100,000 population in 2004: 22,703
General practice office based MDs per 100,000 population in 2005: 1,017
Medical specialist MDs per 100,000 population in 2005: 723
Total births per 100,000 population, July 2005 - July 2006 : 32
Total deaths per 100,000 population, July 2005 - July 2006: 27
Crimes per 100,000 population in 1996: 1
Household type by relationship:
Households: 3,321- Male householders: 341 (159 living alone), Female householders: 521 (125 living alone)
447 spouses (441 opposite-sex spouses), 19 unmarried partners, (19 opposite-sex unmarried partners), 791 children (726 natural, 13 adopted, 51 stepchildren), 131 grandchildren, 2 brothers or sisters, 158 parents, 0 foster children, 32 other relatives, 27 non-relatives
- In group quarters: 818
Size of family households: 367 2-persons, 97 3-persons, 74 4-persons, 13 5-persons, 13 7-or-more-persons.
Size of nonfamily households: 285 1-person, 15 2-persons.
399 married couples with children.
189 single-parent households (27 men, 162 women).
64.7% of residents of Concho speak English at home.
33.6% of residents speak Spanish at home (46% speak English very well, 16% speak English well, 22% speak English not well, 16% don't speak English at all).
1.5% of residents speak other Indo-European language at home (12% speak English well, 4% speak English not well, 84% don't speak English at all).
0.8% of residents speak Asian or Pacific Island language at home (46% speak English very well, 54% speak English not well).
In fiscal year 2004:
Federal Government expenditure: $27,556,000 ($7,360 per capita)
Department of Defense expenditure: $327,000
Federal direct payments to individuals for retirement and disability: $7,249,000
Federal other direct payments to individuals: $5,730,000
Federal direct payments not to individuals: $4,527,000
Federal grants: $8,774,000
Federal procurement contracts: $266,000 ($0,000 Department of Defense)
Federal salaries and wages: $1,011,000 ($0,000 Department of Defense)
Federal Government direct loans: $43,000
Federal guaranteed/insured loans: $228,000
Federal Government insurance: $4,500,000
Population change from April 1, 2000 to July 1, 2005:
Births: 135| Here: | 36 per 1000 residents |
| State: | 85 per 1000 residents |
Deaths: 172
| Here: | 46 per 1000 residents |
| State: | 35 per 1000 residents |
Net international migration: 0
| Here: | 0 per 1000 residents |
| State: | +29 per 1000 residents |
Net internal migration: -182
| Here: | |
| State: |
Total withdrawal of fresh water for public supply: 0.58 millions of gallons per day (88% from ground, 12% from surface)
| Here: | 5.4 |
| State: | 6.3 |
| Here: | 4.8 |
| State: | 4.0 |
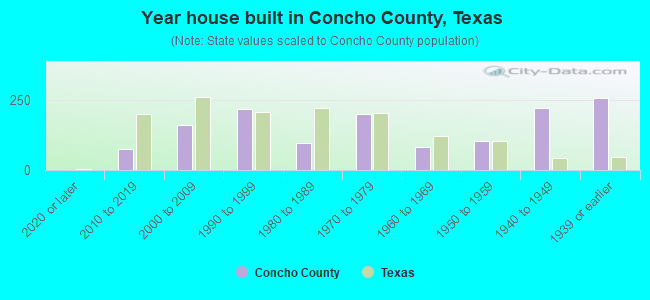
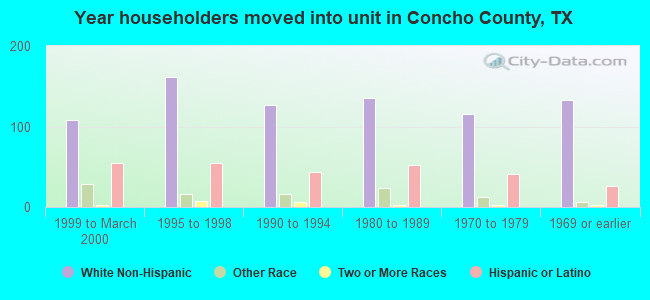
- Year house built in Concho County, Texas
- 22020 or later
- 832010 to 2019
- 1532000 to 2009
- 1761990 to 1999
- 1021980 to 1989
- 1941970 to 1979
- 1121960 to 1969
- 1241950 to 1959
- 1831940 to 1949
- 2681939 or earlier
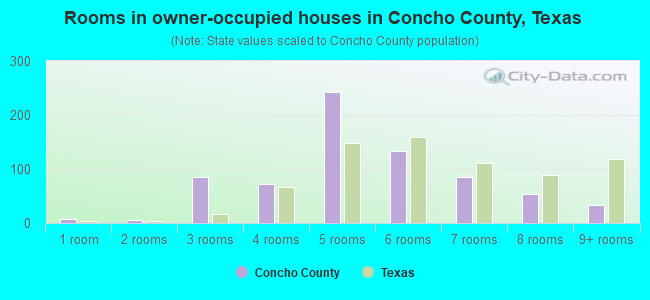
- Rooms in owner-occupied houses in Concho County, Texas
- 51 room
- 162 rooms
- 683 rooms
- 654 rooms
- 2195 rooms
- 1296 rooms
- 1127 rooms
- 668 rooms
- 229+ rooms
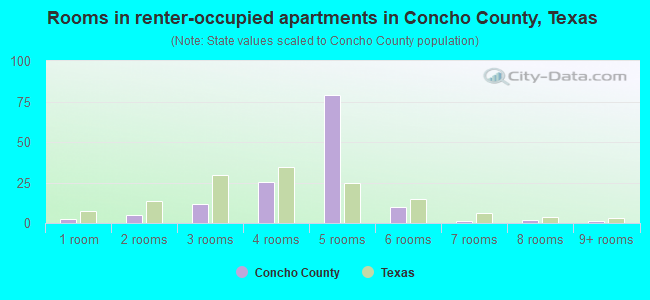
- Rooms in renter-occupied apartments in Concho County, Texas
- 111 room
- 132 rooms
- 93 rooms
- 234 rooms
- 625 rooms
- 256 rooms
- 67 rooms
- 148 rooms
- 19+ rooms
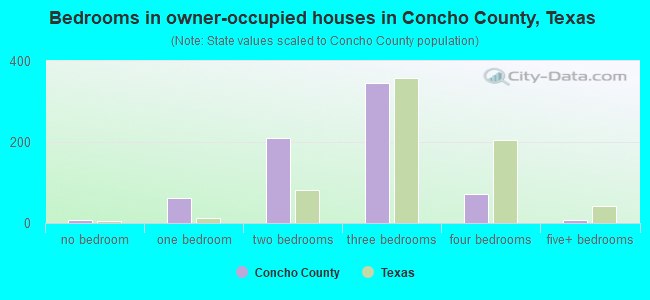
- Bedrooms in owner-occupied houses in Concho County, Texas
- 5no bedroom
- 651 bedroom
- 1762 bedrooms
- 3623 bedrooms
- 744 bedrooms
- 115+ bedrooms
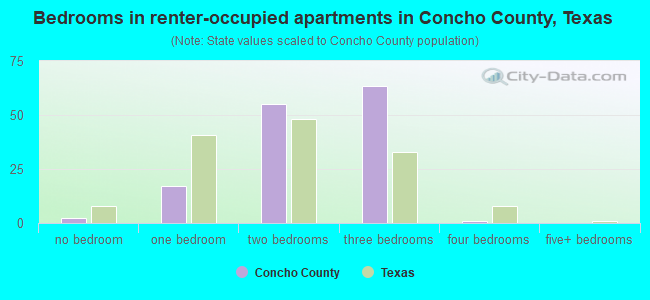
- Bedrooms in renter-occupied apartments in Concho County, Texas
- 11no bedroom
- 221 bedroom
- 572 bedrooms
- 693 bedrooms
- 74 bedrooms
- 05+ bedrooms
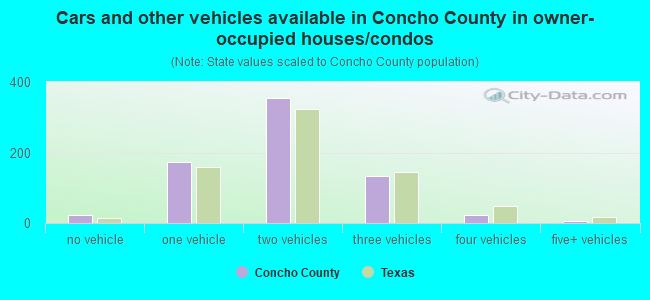
- Cars and other vehicles available in Concho County in owner-occupied houses/condos
- 15no vehicle
- 1631 vehicle
- 3442 vehicles
- 1393 vehicles
- 334 vehicles
- 35+ vehicles
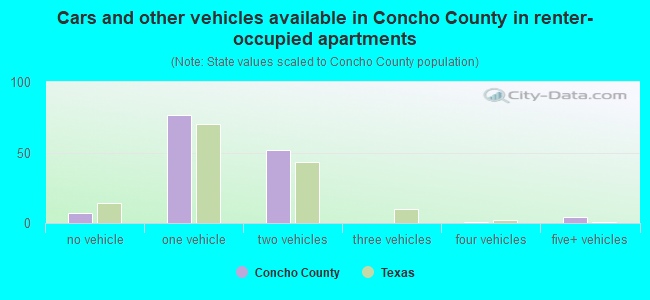
- Cars and other vehicles available in Concho County in renter-occupied apartments
- 24no vehicle
- 931 vehicle
- 442 vehicles
- 53 vehicles
- 14 vehicles
- 05+ vehicles
73.4% of Concho County residents lived in the same house 1 years ago.
Out of people who lived in different houses, 6% lived in this county.
Out of people who lived in different counties, 98% lived in Texas.
| Concho County: | 73.4% |
| State average: | 85.7% |
Place of birth for U.S.-born residents:
- This state: 2,452
- Other state: 469
- Northeast: 49
- Midwest: 63
- South: 285
- West: 68
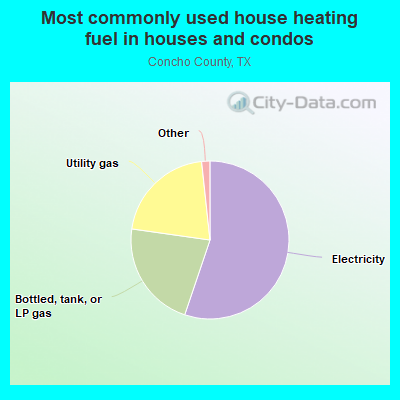
- 54.8%Electricity
- 24.0%Utility gas
- 20.5%Bottled, tank, or LP gas
- 0.6%Fuel oil, kerosene, etc.
- 0.2%Other fuel
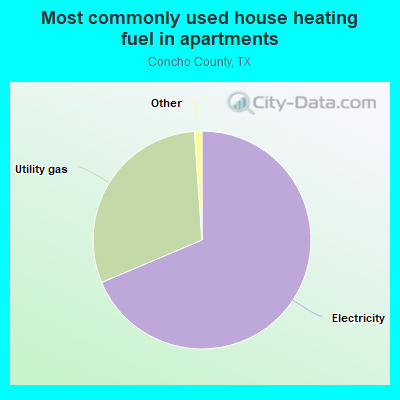
- 52.9%Electricity
- 40.1%Utility gas
- 7.0%Bottled, tank, or LP gas
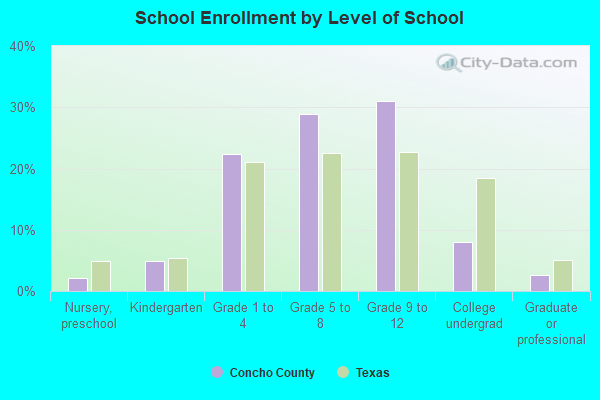
Private vs. public school enrollment:
| Here: | 1.7% |
| Texas: | 8.8% |
| Here: | 0.0% |
| Texas: | 8.0% |
| Here: | 0.0% |
| Texas: | 16.2% |


Concho County government finances - Expenditure in 2017:
- Charges - Other: $581,000
- Current Operations - General - Other: $2,331,000
Central Staff Services: $491,000
Regular Highways: $394,000
Judicial and Legal Services: $358,000
Police Protection: $352,000
Correctional Institutions: $322,000
General Public Buildings: $143,000
Libraries: $128,000
Financial Administration: $120,000
Local Fire Protection: $27,000
Corrections - Other: $19,000
Public Welfare - Other: $10,000
- Miscellaneous - Interest Earnings: $7,000
- Other Capital Outlay - Regular Highways: $219,000
Local Fire Protection: $69,000
Police Protection: $44,000
- Other Funds - Cash and Securities: $1,095,000
- State Intergovernmental - Highways: $58,000
Other: $43,000
- Tax - Property: $2,992,000
- Total Salaries and Wages: $2,331,000
Concho County government finances - Revenue in 2017:
- Charges - Other: $581,000
- Current Operations - General - Other: $2,331,000
Central Staff Services: $491,000
Regular Highways: $394,000
Judicial and Legal Services: $358,000
Police Protection: $352,000
Correctional Institutions: $322,000
General Public Buildings: $143,000
Libraries: $128,000
Financial Administration: $120,000
Local Fire Protection: $27,000
Corrections - Other: $19,000
Public Welfare - Other: $10,000
- Miscellaneous - Interest Earnings: $7,000
- Other Capital Outlay - Regular Highways: $219,000
Local Fire Protection: $69,000
Police Protection: $44,000
- Other Funds - Cash and Securities: $1,095,000
- State Intergovernmental - Highways: $58,000
Other: $43,000
- Tax - Property: $2,992,000
- Total Salaries and Wages: $2,331,000
Concho County government finances - Debt in 2017:
- Charges - Other: $581,000
- Current Operations - General - Other: $2,331,000
Central Staff Services: $491,000
Regular Highways: $394,000
Judicial and Legal Services: $358,000
Police Protection: $352,000
Correctional Institutions: $322,000
General Public Buildings: $143,000
Libraries: $128,000
Financial Administration: $120,000
Local Fire Protection: $27,000
Corrections - Other: $19,000
Public Welfare - Other: $10,000
- Miscellaneous - Interest Earnings: $7,000
- Other Capital Outlay - Regular Highways: $219,000
Local Fire Protection: $69,000
Police Protection: $44,000
- Other Funds - Cash and Securities: $1,095,000
- State Intergovernmental - Highways: $58,000
Other: $43,000
- Tax - Property: $2,992,000
- Total Salaries and Wages: $2,331,000
Concho County government finances - Cash and Securities in 2017:
- Charges - Other: $581,000
- Current Operations - General - Other: $2,331,000
Central Staff Services: $491,000
Regular Highways: $394,000
Judicial and Legal Services: $358,000
Police Protection: $352,000
Correctional Institutions: $322,000
General Public Buildings: $143,000
Libraries: $128,000
Financial Administration: $120,000
Local Fire Protection: $27,000
Corrections - Other: $19,000
Public Welfare - Other: $10,000
- Miscellaneous - Interest Earnings: $7,000
- Other Capital Outlay - Regular Highways: $219,000
Local Fire Protection: $69,000
Police Protection: $44,000
- Other Funds - Cash and Securities: $1,095,000
- State Intergovernmental - Highways: $58,000
Other: $43,000
- Tax - Property: $2,992,000
- Total Salaries and Wages: $2,331,000
Supplemental Security Income (SSI) in 2006:
- Total number of recipients: 67
- Number of aged recipients: 15
- Number of blind and disabled recipients: 52
- Number of recipients under 18: 5
- Number of recipients between 18 and 64: 40
- Number of recipients older than 64: 22
- Number of recipients also receiving OASDI: 33
- Amount of payments (thousands of dollars): 20
| Most common first names in Concho County, TX among deceased individuals | ||
| Name | Count | Lived (average) |
|---|---|---|
| William | 31 | 76.7 years |
| John | 30 | 81.0 years |
| James | 29 | 76.9 years |
| Mary | 17 | 82.1 years |
| Charles | 12 | 77.4 years |
| Robert | 12 | 77.5 years |
| Frank | 11 | 83.3 years |
| Lois | 10 | 76.5 years |
| Thomas | 10 | 77.8 years |
| Annie | 9 | 85.2 years |
| Most common last names in Concho County, TX among deceased individuals | ||
| Last name | Count | Lived (average) |
|---|---|---|
| Smith | 22 | 72.2 years |
| Prosise | 17 | 73.3 years |
| Hall | 10 | 84.8 years |
| Williams | 10 | 74.5 years |
| Stephens | 10 | 83.7 years |
| Green | 10 | 83.5 years |
| Taylor | 10 | 78.5 years |
| Hernandez | 9 | 61.0 years |
| Davis | 8 | 77.1 years |
| Mcguffin | 8 | 80.0 years |
Businesses in Concho County, TX
- Chevrolet: 1
- SONIC Drive-In: 1
- UPS: 1
Concho County on our top lists:
- #40 on the list of "Top 101 counties with the lowest surface withdrawal of fresh water for public supply"