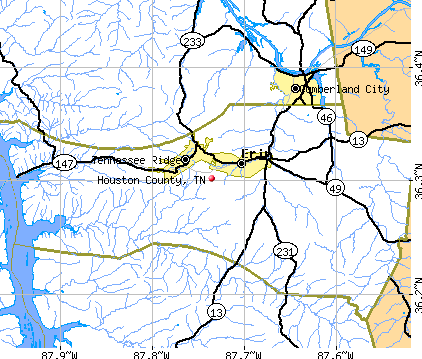
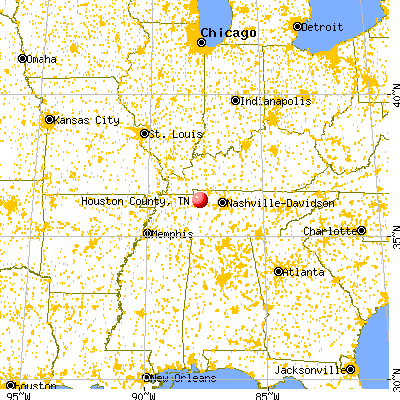
Houston County, Tennessee (TN)
County owner-occupied free and clear houses and condos in 2010: 1,179
County owner-occupied houses and condos in 2000: 2,475
Renter-occupied apartments: 805 (it was 741 in 2000)
| % of renters here: | 23% |
| State: | 32% |
Land area: 200 sq. mi.
Water area: 6.7 sq. mi.
Population density: 42 people per square mile (average).
Industries providing employment: Manufacturing (20.9%), Educational, health and social services (16.1%), Construction (14.9%), Retail trade (14.9%).
Type of workers:
- Private wage or salary: 72%
- Government: 20%
- Self-employed, not incorporated: 8%
- Unpaid family work: 0%
- OSM Map
- General Map
- Google Map
- MSN Map

- 7,57890.4%White Non-Hispanic Alone
- 2743.3%Black Non-Hispanic Alone
- 2513.0%Hispanic or Latino
- 2102.5%Two or more races
- 270.3%Asian alone
- 260.3%Native Hawaiian and Other
Pacific Islander alone - 190.2%American Indian and Alaska Native alone

| Median resident age: | 44.4 years |
| Tennessee median age: | 39.2 years |
| Males: 4,182 | |
| Females: 4,223 |

 | COVID-19 in Tennessee (237 replies) |
| Tennessee Population Estimates 2016 (28 replies) |
| Coming to TN would love advice. (15 replies) |
| Tennessee counties, 1900 - 2010 (3 replies) |
| Tennessee counties ranked by population (24 replies) |
| Would you say Nashville meets this description? (9 replies) |
| Houston County: | 2.0 people |
| Tennessee: | 2 people |
Estimated median household income in 2022: $52,525 ($29,968 in 1999)
| This county: | $52,525 |
| Tennessee: | $65,254 |
Median contract rent in 2022 for apartments: $507 (lower quartile is $377, upper quartile is $667)
| This county: | $507 |
| State: | $884 |
Estimated median house or condo value in 2022: $183,077 (it was $61,900 in 2000)
| Houston: | $183,077 |
| Tennessee: | $284,800 |
Median monthly housing costs for homes and condos with a mortgage: $1,219
Median monthly housing costs for units without a mortgage: $391
Institutionalized population: 162
Crime in 2021 (reported by the sheriff's office or county police, not the county total):
- Murders: 0
- Rapes: 0
- Robberies: 0
- Assaults: 13
- Burglaries: 10
- Thefts: 59
- Auto thefts: 7
Crime in 2020 (reported by the sheriff's office or county police, not the county total):
- Murders: 1
- Rapes: 0
- Robberies: 0
- Assaults: 41
- Burglaries: 13
- Thefts: 54
- Auto thefts: 8
Single-family new house construction building permits:
- 2022: 2 buildings, average cost: $253,200
- 2021: 1 building, cost: $217,500
- 2020: 0 buildings
- 2019: 2 buildings, average cost: $60,000
- 2018: 0 buildings
- 2017: 1 building, cost: $110,000
- 2016: 0 buildings
- 2015: 1 building, cost: $275,000
- 2014: 1 building, cost: $298,900
- 2013: 0 buildings
- 2012: 2 buildings, average cost: $126,200
- 2011: 1 building, cost: $51,800
- 2010: 3 buildings, average cost: $117,900
- 2009: 2 buildings, average cost: $119,500
- 2008: 1 building, cost: $50,000
- 2007: 1 building, cost: $55,900
- 2006: 1 building, cost: $182,000
- 2005: 4 buildings, average cost: $98,700
- 2004: 3 buildings, average cost: $98,700
- 2003: 1 building, cost: $126,500
- 2002: 2 buildings, average cost: $55,000
- 2001: 2 buildings, average cost: $110,000
- 2000: 2 buildings, average cost: $69,300
- 1999: 6 buildings, average cost: $64,700
- 1998: 1 building, cost: $100,000
- 1997: 1 building, cost: $100,000


Median real estate property taxes paid for housing units with mortgages in 2022: $1,006 (0.5%)
Median real estate property taxes paid for housing units with no mortgage in 2022: $790 (0.5%)


| Houston County: | 12.7% |
| Tennessee: | 13.3% |
Median age of residents in 2022: 44.4 years old
(Males: 41.7 years old, Females: 45.1 years old)
(Median age for: White residents: 44.8 years old, Black residents: 46.3 years old, American Indian residents: 54.0 years old, Hispanic or Latino residents: 11.0 years old)
Fair market rent in 2006 for a 1-bedroom apartment in Houston County is $364 a month.
Fair market rent for a 2-bedroom apartment is $460 a month.
Fair market rent for a 3-bedroom apartment is $569 a month.
Cities in this county include: Erin, Tennessee Ridge.
Notable locations in this county outside city limits:
Notable locations in Houston County: Way (A), Harmon Creek Boat Dock (B), Birdsong Drive-In (C), Rushing Creek Community Center (D), West Camden Sanitary Landfill (E), Frog Alley (F), West Tennessee Boy Scout Camp (G), Young Farmers and Homemakers Camp (H), Whites Resort (I), Whites Camp Dock (J), West Sycamore Landing (K), West Dixie Landing (L), West Cuba Landing (M), Sulphur Creek Dock (N), Sugar Tree Marina (O), Snows Camp Dock (P), Sandys Camp Dock (Q), Sandys Camp (R), Randys Camp Dock (S), Randys Camp (T). Display/hide their locations on the map
Churches in Houston County include: Flatwoods Church (A), Liberty Methodist Church (B), Mount Carmel Church (C), Liberty Church (D), Ramble Creek Baptist Church (E), Rushing Church (F), Rushings Creek Baptist Church (G), Baker Chapel (H), Cowells Chapel (I). Display/hide their locations on the map
Cemeteries: Hudson Cemetery (1), Irish Cemetery (2), Tippitt Cemetery (3), Jordan Cemetery (4), Weatherly Cemetery (5), Wheatley Cemetery (6), Willbanks Cemetery (7). Display/hide their locations on the map
Reservoirs: Melton Pond (A), Lester Jackson Lake (B), Dyer Lake (C), Butterworth Lake (D), Blackburn Lake (E), Cole Lake (F), Hardy Sand Company Lake (G), C H Sullins Lake (H). Display/hide their locations on the map
Streams, rivers, and creeks: Lockhart Branch (A), Little Birdsong Creek (B), Ballard Branch (C), Badger Creek (D), Jones Creek (E), Jones Branch (F), Jepp Branch (G), Hurricane Branch (H), Hope Creek (I). Display/hide their locations on the map
Parks in Houston County include: Nathan Bedford Forrest State Park (1), Tennessee National Wildlife Refuge (2), Nathan Bedford Forrest State Historic Area (3), Big Sandy Municipal Park (4), Benton County Park (5). Display/hide their locations on the map
Neighboring counties: Decatur County  , Edgecombe County, North Carolina
  , Payne County, Oklahoma
  , Maury County
  , Morgan County , Weakley County , Galax city, Virginia .
| Here: | 4.2% |
| Tennessee: | 3.0% |


Current college students: 138
People 25 years of age or older with a high school degree or higher: 84.0%
People 25 years of age or older with a bachelor's degree or higher: 11.4%
Number of foreign born residents: 89 (64.5% naturalized citizens)
| Houston County: | 1.1% |
| Whole state: | 5.6% |

- Year of entry for the foreign-born population
- 132010 or later
- 52000 to 2009
- 331990 to 1999
- 371980 to 1989
- 31970 to 1979
- 28Before 1970
Mean travel time to work (commute): & minutes
Percentage of county residents living and working in this county: 97.0%
Housing units in structures:
- One, detached: 3,044
- One, attached: 25
- Two: 49
- 3 or 4: 27
- 5 to 9: 48
- 10 to 19: 2
- 20 or more: 7
- Mobile homes: 835
Housing units in Houston County with a mortgage: 1,033 (214 second mortgage, 17 home equity loan, 197 both second mortgage and home equity loan)
Houses without a mortgage: 0
| Here: | 100.0% with mortgage |
| State: | 97.8% with mortgage |
Religion statistics for Houston County
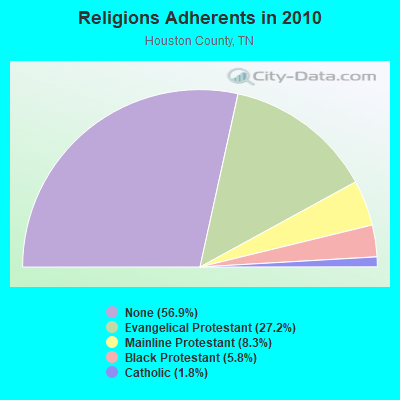
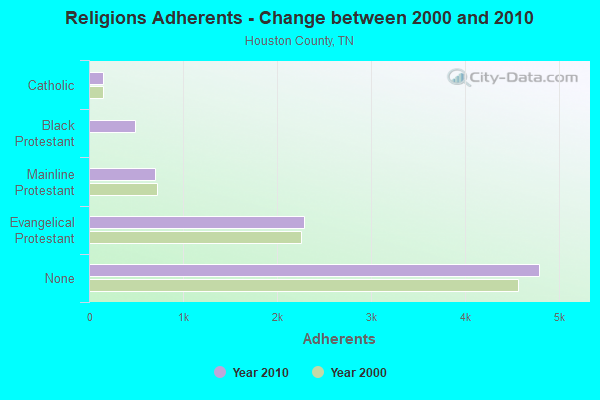
| Religion | Adherents | Congregations |
|---|---|---|
| Evangelical Protestant | 2,292 | 16 |
| Mainline Protestant | 703 | 10 |
| Black Protestant | 488 | 3 |
| Catholic | 150 | 1 |
| None | 4,793 | - |
Source: Clifford Grammich, Kirk Hadaway, Richard Houseal, Dale E.Jones, Alexei Krindatch, Richie Stanley and Richard H.Taylor. 2012. 2010 U.S.Religion Census: Religious Congregations & Membership Study. Association of Statisticians of American Religious Bodies. Jones, Dale E., et al. 2002. Congregations and Membership in the United States 2000. Nashville, TN: Glenmary Research Center.
Food Environment Statistics:
| Houston County: | 2.48 / 10,000 pop. |
| State: | 1.99 / 10,000 pop. |
| Houston County: | 6.19 / 10,000 pop. |
| Tennessee: | 5.16 / 10,000 pop. |
| This county: | 11.15 / 10,000 pop. |
| State: | 6.56 / 10,000 pop. |
| Houston County: | 12.0% |
| Tennessee: | 11.4% |
| Houston County: | 29.8% |
| State: | 30.2% |
| Here: | 8.4% |
| State: | 13.5% |
Agriculture in Houston County:
Average size of farms: 145 acresAverage value of agricultural products sold per farm: $13,485
Average value of crops sold per acre for harvested cropland: $58.38
The value of livestock, poultry, and their products as a percentage of the total market value of agricultural products sold: 85.64%
Average total farm production expenses per farm: $14,692
Harvested cropland as a percentage of land in farms: 22.83%
Irrigated harvested cropland as a percentage of land in farms: 0.34%
Average market value of all machinery and equipment per farm: $34,984
The percentage of farms operated by a family or individual: 95.24%
Average age of principal farm operators: 54 years
Average number of cattle and calves per 100 acres of all land in farms: 24.84
Corn for grain: 379 harvested acres
All wheat for grain: 25 harvested acres
Tornado activity:
Houston County historical area-adjusted tornado activity is significantly below Tennessee state average. It is 585509.8 times below overall U.S. average.Tornadoes in this county have caused 4 fatalities and 48 injuries recorded between 1950 and 2004.
On 1/19/1988, a category 3 (max. wind speeds 158-206 mph) tornado killed 3 people and injured 24 people and caused between $500,000 and $5,000,000 in damages.
Earthquake activity:
Houston County-area historical earthquake activity is significantly above Tennessee state average. It is 259% greater than the overall U.S. average.On 4/18/2008 at 09:36:59, a magnitude 5.4 (5.1 MB, 4.8 MS, 5.4 MW, 5.2 MW, Class: Moderate, Intensity: VI - VII) earthquake occurred 149.0 miles away from Houston County center
On 4/18/2008 at 09:36:59, a magnitude 5.2 (5.2 MW, Depth: 8.9 mi) earthquake occurred 148.9 miles away from the county center
On 9/26/1990 at 13:18:51, a magnitude 5.0 (4.7 MB, 4.8 LG, 5.0 LG, Depth: 7.7 mi) earthquake occurred 116.3 miles away from the county center
On 6/18/2002 at 17:37:15, a magnitude 5.0 (4.3 MB, 4.6 MW, 5.0 LG) earthquake occurred 116.6 miles away from the county center
On 5/4/1991 at 01:18:54, a magnitude 5.0 (4.4 MB, 4.6 LG, 5.0 LG, Depth: 3.1 mi) earthquake occurred 117.6 miles away from Houston County center
On 3/25/1976 at 00:41:20, a magnitude 5.0 (4.9 MB, 5.0 LG) earthquake occurred 152.2 miles away from the county center
Magnitude types: regional Lg-wave magnitude (LG), body-wave magnitude (MB), surface-wave magnitude (MS), moment magnitude (MW)
Most recent natural disasters:
- Tennessee Severe Storms, Straight-line Winds, And Flooding, Incident Period: May 3, 2020 - May 4, 2020, Major Disaster (Presidential) Declared DR-4550-TN: July 9, 2020, FEMA Id: 4550, Natural disaster type: Storm, Flood, Wind
- Tennessee Covid-19 Pandemic, Incident Period: January 20, 2020, FEMA Id: 4514, Natural disaster type: Other
- Tennessee Severe Storm And Straight-line Winds, Incident Period: October 26, 2019, FEMA Id: 4471, Natural disaster type: Storm, Wind
- Tennessee Severe Storms, Flooding, Landslides, And Mudslides, Incident Period: February 19, 2019 - March 30, 2019, FEMA Id: 4427, Natural disaster type: Storm, Mudslide, Landslide, Flood
- Tennessee Severe Storms, Tornadoes, Straight-line Winds, and Flooding, Incident Period: June 05, 2014 to June 10, 2014, Major Disaster (Presidential) Declared DR-4189: August 13, 2014, FEMA Id: 4189, Natural disaster type: Storm, Tornado, Flood, Wind
- Tennessee Severe Winter Storm, Incident Period: March 02, 2014 to March 04, 2014, Major Disaster (Presidential) Declared DR-4171: April 11, 2014, FEMA Id: 4171, Natural disaster type: Winter Storm
- Tennessee Severe Storms, Tornadoes, Straight-line Winds, and Associated Flooding, Incident Period: April 25, 2011 to April 28, 2011, Major Disaster (Presidential) Declared DR-1974: May 01, 2011, FEMA Id: 1974, Natural disaster type: Storm, Tornado, Flood, Wind
- Tennessee Severe Storms, Tornadoes, and Flooding, Incident Period: February 28, 2011 to March 01, 2011, Major Disaster (Presidential) Declared DR-1965: March 31, 2011, FEMA Id: 1965, Natural disaster type: Storm, Tornado, Flood
- Tennessee Severe Storms, Flooding, Straight-Line Winds, and Tornadoes, Incident Period: April 30, 2010 to May 18, 2010, Major Disaster (Presidential) Declared DR-1909: May 04, 2010, FEMA Id: 1909, Natural disaster type: Storm, Tornado, Flood, Wind
- Tennessee Severe Storms, Tornadoes, Straight-line Winds, and Flooding, Incident Period: February 05, 2008 to February 06, 2008, Major Disaster (Presidential) Declared DR-1745: February 07, 2008, FEMA Id: 1745, Natural disaster type: Storm, Tornado, Flood, Wind
- 10 other natural disasters have been reported since 1953.
The number of natural disasters in Houston County (20) is greater than the US average (15).
Major Disasters (Presidential) Declared: 16
Emergencies Declared: 1
Causes of natural disasters: Storms: 15, Floods: 13, Tornadoes: 10, Winds: 7, Winter Storms: 2, Flash Flood: 1, Hurricane: 1, Ice Storm: 1, Landslide: 1, Mudslide: 1, Other: 1 (Note: some incidents may be assigned to more than one category).

Means of transportation to work:
- Drove a car alone: 1,254 (71.6%)
- Carpooled: 295 (16.8%)
- Bus: 3 (0.2%)
- Taxicab, motorcycle, or other means: 45 (2.6%)
- Walked: 34 (1.9%)
- Worked at home: 89 (5.1%)


- Health care and social assistance (21%)
- Retail trade (20%)
- Manufacturing (14%)
- Educational services (9%)
- Public administration (8%)
- Agriculture, forestry, fishing and hunting (8%)
- Professional, scientific, and technical services (5%)

- Health care and social assistance (20%)
- Retail trade (19%)
- Manufacturing (13%)
- Educational services (8%)
- Public administration (8%)
- Agriculture, forestry, fishing and hunting (8%)
- Professional, scientific, and technical services (5%)

- Production occupations (25%)
- Construction and extraction occupations (19%)
- Management occupations (12%)
- Material moving occupations (8%)
- Transportation occupations (6%)
- Sales and related occupations (5%)
- Installation, maintenance, and repair occupations (5%)

- Office and administrative support occupations (20%)
- Sales and related occupations (12%)
- Production occupations (9%)
- Healthcare support occupations (9%)
- Management occupations (8%)
- Health technologists and technicians (7%)
- Construction and extraction occupations (7%)

- China, excluding Hong Kong and Taiwan (31%)
- Germany (17%)
- Canada (16%)
- Kazakhstan (7%)
- Asia, n.e.c. (7%)
- France (6%)
- Mexico (4%)

- American (48%)
- Irish (12%)
- English (7%)
- German (4%)
- Polish (2%)
- European (2%)
- Scotch-Irish (2%)


People in group quarters in Houston County, Tennessee in 2010:
- 142 people in nursing facilities/skilled-nursing facilities
- 20 people in local jails and other municipal confinement facilities
- 15 people in group homes intended for adults
People in group quarters in Houston County, Tennessee in 2000:
- 160 people in nursing homes
- 17 people in local jails and other confinement facilities (including police lockups)
- 13 people in homes for the mentally ill
8.30% of this county's 2021 resident taxpayers lived in other counties in 2020 ($49,395 average adjusted gross income)
| Here: | 8.30% |
| Tennessee average: | 8.49% |
10 or fewer of this county's residents moved from foreign countries.
5.50% relocated from other counties in Tennessee ($27,107 average AGI)
2.80% relocated from other states ($22,288 average AGI)
Houston County: 2.80% Tennessee average: 4.34%

Top counties from which taxpayers relocated into this county between 2020 and 2021:
| from Montgomery County, TN | |
| from Stewart County, TN | |
| from Dickson County, TN |
6.35% of this county's 2020 resident taxpayers moved to other counties in 2021 ($40,440 average adjusted gross income)
| Here: | 6.35% |
| Tennessee average: | 7.40% |
10 or fewer of this county's residents moved to foreign countries.
5.27% relocated to other counties in Tennessee ($32,159 average AGI)
1.08% relocated to other states ($8,280 average AGI)
Houston County: 1.08% Tennessee average: 3.20%

Top counties to which taxpayers relocated from this county between 2020 and 2021:
| to Montgomery County, TN | |
| to Dickson County, TN | |
| to Stewart County, TN | |
| to Humphreys County, TN |
Births per 1000 population from 1990 to 1999: 13.1
Births per 1000 population from 2000 to 2006: 12.8

Deaths per 1000 population from 1990 to 1999: 12.4
Deaths per 1000 population from 2000 to 2009: 13.0
Deaths per 1000 population from 2010 to 2020: 14.2

Infant deaths per 1000 live births from 1990 to 1999: 6.4
Infant deaths per 1000 live births from 2000 to 2006: 8.7

Persons under 19 years old without health insurance coverage in 2018: 5.3%


Persons enrolled in hospital insurance and/or supplemental medical insurance (Medicare) in July 1, 2007: 1,548 (1,211 aged, 337 disabled)
Children under 18 without health insurance coverage in 2007: 235 (12%)


Most common underlying causes of death in Houston County, Tennessee in 1999 - 2019:
- Acute myocardial infarction, unspecified (88)
- Bronchus or lung, unspecified - Malignant neoplasms (61)
- Unspecified dementia (34)
- Atherosclerotic cardiovascular disease, so described (22)
- Chronic obstructive pulmonary disease, unspecified (20)
- Atherosclerotic heart disease (10)
Population without health insurance coverage in 2000: 15%
Children under 18 without health insurance coverage in 2000: 10%
Short term general hospital admissions per 100,000 population in 2004: 15,528
Short term general hospital beds per 100,000 population in 2004: 388
Emergency room visits per 100,000 population in 2004: 86,724
General practice office based MDs per 100,000 population in 2005: 1,577
Medical specialist MDs per 100,000 population in 2005: 1,327
Total births per 100,000 population, July 2005 - July 2006 : 25
Total deaths per 100,000 population, July 2005 - July 2006: 38
Household type by relationship:
Households: 8,405- Male householders: 1,456 (456 living alone), Female householders: 1,718 (608 living alone)
1,470 spouses (1,454 opposite-sex spouses), 252 unmarried partners, (252 opposite-sex unmarried partners), 2,465 children (2,135 natural, 80 adopted, 242 stepchildren), 219 grandchildren, 7 brothers or sisters, 137 parents, 0 foster children, 194 other relatives, 240 non-relatives
- In group quarters: 203
Size of family households: 1,057 2-persons, 488 3-persons, 244 4-persons, 74 5-persons, 57 6-persons, 31 7-or-more-persons.
Size of nonfamily households: 1,066 1-person, 139 2-persons, 9 5-persons.
1,151 married couples with children.
287 single-parent households (157 men, 130 women).
99.2% of residents of Houston speak English at home.
0.3% of residents speak Spanish at home (91% speak English very well, 9% don't speak English at all).
0.3% of residents speak other Indo-European language at home (62% speak English very well, 38% speak English well).
In fiscal year 2004:
Federal Government expenditure: $55,876,000 ($6,991 per capita)
Department of Defense expenditure: $2,895,000
Federal direct payments to individuals for retirement and disability: $26,059,000
Federal other direct payments to individuals: $12,071,000
Federal direct payments not to individuals: $126,000
Federal grants: $14,839,000
Federal procurement contracts: $715,000 ($65,000 Department of Defense)
Federal salaries and wages: $2,067,000 ($607,000 Department of Defense)
Federal Government direct loans: $1,568,000
Federal guaranteed/insured loans: $828,000
Federal Government insurance: $4,587,000
Population change from April 1, 2000 to July 1, 2005:
Births: 520| Here: | 65 per 1000 residents |
| State: | 69 per 1000 residents |
Deaths: 576
| Here: | 72 per 1000 residents |
| State: | 50 per 1000 residents |
Net international migration: +45
| Here: | +6 per 1000 residents |
| State: | +8 per 1000 residents |
Net internal migration: -69
| Here: | |
| State: |

Total withdrawal of fresh water for public supply: 1.13 millions of gallons per day (14% from ground, 86% from surface)
| Here: | 6.1 |
| State: | 6.5 |
| Here: | 4.9 |
| State: | 4.4 |

- Year house built in Houston County, Tennessee
- 52020 or later
- 2512010 to 2019
- 4382000 to 2009
- 7241990 to 1999
- 5831980 to 1989
- 8181970 to 1979
- 3251960 to 1969
- 2191950 to 1959
- 1471940 to 1949
- 4191939 or earlier

- Rooms in owner-occupied houses in Houston County, Tennessee
- 01 room
- 152 rooms
- 783 rooms
- 1834 rooms
- 6655 rooms
- 5856 rooms
- 5497 rooms
- 2608 rooms
- 2049+ rooms

- Rooms in renter-occupied apartments in Houston County, Tennessee
- 01 room
- 362 rooms
- 993 rooms
- 964 rooms
- 1585 rooms
- 1286 rooms
- 597 rooms
- 88 rooms
- 419+ rooms

- Bedrooms in owner-occupied houses in Houston County, Tennessee
- 0no bedroom
- 581 bedroom
- 4322 bedrooms
- 1,7023 bedrooms
- 3134 bedrooms
- 285+ bedrooms

- Bedrooms in renter-occupied apartments in Houston County, Tennessee
- 0no bedroom
- 921 bedroom
- 1992 bedrooms
- 2583 bedrooms
- 644 bedrooms
- 125+ bedrooms

- Cars and other vehicles available in Houston County in owner-occupied houses/condos
- 78no vehicle
- 6341 vehicle
- 9232 vehicles
- 6523 vehicles
- 1654 vehicles
- 905+ vehicles

- Cars and other vehicles available in Houston County in renter-occupied apartments
- 52no vehicle
- 3141 vehicle
- 1922 vehicles
- 433 vehicles
- 194 vehicles
- 125+ vehicles
90.5% of Houston County residents lived in the same house 1 years ago.
Out of people who lived in different houses, 20% lived in this county.
Out of people who lived in different counties, 82% lived in Tennessee.
| Houston County: | 90.5% |
| State average: | 87.0% |
Place of birth for U.S.-born residents:
- This state: 5,221
- Other state: 2,930
- Northeast: 393
- Midwest: 1,046
- South: 1,170
- West: 314


- 66.7%Electricity
- 14.7%Utility gas
- 10.7%Bottled, tank, or LP gas
- 7.1%Wood
- 0.5%Fuel oil, kerosene, etc.
- 0.2%No fuel used
- 0.1%Other fuel

- 87.1%Electricity
- 5.1%Utility gas
- 4.5%Bottled, tank, or LP gas
- 3.0%Wood
- 0.3%Fuel oil, kerosene, etc.
Private vs. public school enrollment:
| Here: | 9.5% |
| Tennessee: | 15.0% |
| Here: | 12.2% |
| Tennessee: | 16.2% |
| Here: | 5.1% |
| Tennessee: | 23.5% |


Houston County government finances - Expenditure in 2017:
- Charges - Other: $843,000
Elementary and Secondary Education - Other: $599,000
Elementary and Secondary Education School Lunch: $259,000
Elementary and Secondary Education School Tuition and Transportation: $9,000
Air Transportation: $4,000
- Construction - Regular Highways: $64,000
Elementary and Secondary Education: $62,000
Local Fire Protection: $53,000
Housing and Community Development: $30,000
General Public Buildings: $2,000
General - Other: $2,000
- Current Operations - Elementary and Secondary Education: $11,747,000
Regular Highways: $1,724,000
Health - Other: $998,000
General - Other: $793,000
Police Protection: $567,000
Correctional Institutions: $520,000
Central Staff Services: $421,000
Judicial and Legal Services: $380,000
Financial Administration: $359,000
Solid Waste Management: $327,000
Libraries: $132,000
Local Fire Protection: $78,000
General Public Buildings: $77,000
Natural Resources - Other: $50,000
Air Transportation: $13,000
- Federal Intergovernmental - Housing and Community Development: $76,000
- General - Interest on Debt: $435,000
- Intergovernmental to Local - Other - General - Other: $447,000
Other - Public Welfare - Other: $82,000
Other - Parks and Recreation: $35,000
Other - Health - Other: $16,000
- Local Intergovernmental - General Local Government Support: $52,000
Education: $22,000
- Long Term Debt - Beginning Outstanding - Unspecified Public Purpose: $10,866,000
Outstanding Unspecified Public Purpose: $10,147,000
Retired Unspecified Public Purpose: $719,000
- Miscellaneous - General Revenue - Other: $182,000
Interest Earnings: $136,000
Sale of Property: $100,000
Rents: $74,000
Fines and Forfeits: $68,000
Donations From Private Sources: $2,000
- Other Capital Outlay - Regular Highways: $244,000
Elementary and Secondary Education: $163,000
Local Fire Protection: $161,000
Housing and Community Development: $65,000
Solid Waste Management: $12,000
Judicial and Legal Services: $11,000
Financial Administration: $8,000
Police Protection: $8,000
General - Other: $8,000
Central Staff Services: $3,000
Natural Resources - Other: $3,000
Health - Other: $2,000
Correctional Institutions: $1,000
- Other Funds - Cash and Securities: $7,490,000
- Sinking Funds - Cash and Securities: $1,621,000
- State Intergovernmental - Education: $10,301,000
Highways: $2,387,000
Other: $542,000
General Local Government Support: $183,000
- Tax - Property: $2,390,000
General Sales and Gross Receipts: $878,000
Motor Vehicle License: $266,000
Occupation and Business License - Other: $30,000
Other Selective Sales: $29,000
Alcoholic Beverage Sales: $24,000
Public Utility License: $2,000
Other License: $1,000
- Total Salaries and Wages: $7,490,000
Houston County government finances - Revenue in 2017:
- Charges - Other: $843,000
Elementary and Secondary Education - Other: $599,000
Elementary and Secondary Education School Lunch: $259,000
Elementary and Secondary Education School Tuition and Transportation: $9,000
Air Transportation: $4,000
- Construction - Regular Highways: $64,000
Elementary and Secondary Education: $62,000
Local Fire Protection: $53,000
Housing and Community Development: $30,000
General Public Buildings: $2,000
General - Other: $2,000
- Current Operations - Elementary and Secondary Education: $11,747,000
Regular Highways: $1,724,000
Health - Other: $998,000
General - Other: $793,000
Police Protection: $567,000
Correctional Institutions: $520,000
Central Staff Services: $421,000
Judicial and Legal Services: $380,000
Financial Administration: $359,000
Solid Waste Management: $327,000
Libraries: $132,000
Local Fire Protection: $78,000
General Public Buildings: $77,000
Natural Resources - Other: $50,000
Air Transportation: $13,000
- Federal Intergovernmental - Housing and Community Development: $76,000
- General - Interest on Debt: $435,000
- Intergovernmental to Local - Other - General - Other: $447,000
Other - Public Welfare - Other: $82,000
Other - Parks and Recreation: $35,000
Other - Health - Other: $16,000
- Local Intergovernmental - General Local Government Support: $52,000
Education: $22,000
- Long Term Debt - Beginning Outstanding - Unspecified Public Purpose: $10,866,000
Outstanding Unspecified Public Purpose: $10,147,000
Retired Unspecified Public Purpose: $719,000
- Miscellaneous - General Revenue - Other: $182,000
Interest Earnings: $136,000
Sale of Property: $100,000
Rents: $74,000
Fines and Forfeits: $68,000
Donations From Private Sources: $2,000
- Other Capital Outlay - Regular Highways: $244,000
Elementary and Secondary Education: $163,000
Local Fire Protection: $161,000
Housing and Community Development: $65,000
Solid Waste Management: $12,000
Judicial and Legal Services: $11,000
Financial Administration: $8,000
Police Protection: $8,000
General - Other: $8,000
Central Staff Services: $3,000
Natural Resources - Other: $3,000
Health - Other: $2,000
Correctional Institutions: $1,000
- Other Funds - Cash and Securities: $7,490,000
- Sinking Funds - Cash and Securities: $1,621,000
- State Intergovernmental - Education: $10,301,000
Highways: $2,387,000
Other: $542,000
General Local Government Support: $183,000
- Tax - Property: $2,390,000
General Sales and Gross Receipts: $878,000
Motor Vehicle License: $266,000
Occupation and Business License - Other: $30,000
Other Selective Sales: $29,000
Alcoholic Beverage Sales: $24,000
Public Utility License: $2,000
Other License: $1,000
- Total Salaries and Wages: $7,490,000
Houston County government finances - Debt in 2017:
- Charges - Other: $843,000
Elementary and Secondary Education - Other: $599,000
Elementary and Secondary Education School Lunch: $259,000
Elementary and Secondary Education School Tuition and Transportation: $9,000
Air Transportation: $4,000
- Construction - Regular Highways: $64,000
Elementary and Secondary Education: $62,000
Local Fire Protection: $53,000
Housing and Community Development: $30,000
General Public Buildings: $2,000
General - Other: $2,000
- Current Operations - Elementary and Secondary Education: $11,747,000
Regular Highways: $1,724,000
Health - Other: $998,000
General - Other: $793,000
Police Protection: $567,000
Correctional Institutions: $520,000
Central Staff Services: $421,000
Judicial and Legal Services: $380,000
Financial Administration: $359,000
Solid Waste Management: $327,000
Libraries: $132,000
Local Fire Protection: $78,000
General Public Buildings: $77,000
Natural Resources - Other: $50,000
Air Transportation: $13,000
- Federal Intergovernmental - Housing and Community Development: $76,000
- General - Interest on Debt: $435,000
- Intergovernmental to Local - Other - General - Other: $447,000
Other - Public Welfare - Other: $82,000
Other - Parks and Recreation: $35,000
Other - Health - Other: $16,000
- Local Intergovernmental - General Local Government Support: $52,000
Education: $22,000
- Long Term Debt - Beginning Outstanding - Unspecified Public Purpose: $10,866,000
Outstanding Unspecified Public Purpose: $10,147,000
Retired Unspecified Public Purpose: $719,000
- Miscellaneous - General Revenue - Other: $182,000
Interest Earnings: $136,000
Sale of Property: $100,000
Rents: $74,000
Fines and Forfeits: $68,000
Donations From Private Sources: $2,000
- Other Capital Outlay - Regular Highways: $244,000
Elementary and Secondary Education: $163,000
Local Fire Protection: $161,000
Housing and Community Development: $65,000
Solid Waste Management: $12,000
Judicial and Legal Services: $11,000
Financial Administration: $8,000
Police Protection: $8,000
General - Other: $8,000
Central Staff Services: $3,000
Natural Resources - Other: $3,000
Health - Other: $2,000
Correctional Institutions: $1,000
- Other Funds - Cash and Securities: $7,490,000
- Sinking Funds - Cash and Securities: $1,621,000
- State Intergovernmental - Education: $10,301,000
Highways: $2,387,000
Other: $542,000
General Local Government Support: $183,000
- Tax - Property: $2,390,000
General Sales and Gross Receipts: $878,000
Motor Vehicle License: $266,000
Occupation and Business License - Other: $30,000
Other Selective Sales: $29,000
Alcoholic Beverage Sales: $24,000
Public Utility License: $2,000
Other License: $1,000
- Total Salaries and Wages: $7,490,000
Houston County government finances - Cash and Securities in 2017:
- Charges - Other: $843,000
Elementary and Secondary Education - Other: $599,000
Elementary and Secondary Education School Lunch: $259,000
Elementary and Secondary Education School Tuition and Transportation: $9,000
Air Transportation: $4,000
- Construction - Regular Highways: $64,000
Elementary and Secondary Education: $62,000
Local Fire Protection: $53,000
Housing and Community Development: $30,000
General Public Buildings: $2,000
General - Other: $2,000
- Current Operations - Elementary and Secondary Education: $11,747,000
Regular Highways: $1,724,000
Health - Other: $998,000
General - Other: $793,000
Police Protection: $567,000
Correctional Institutions: $520,000
Central Staff Services: $421,000
Judicial and Legal Services: $380,000
Financial Administration: $359,000
Solid Waste Management: $327,000
Libraries: $132,000
Local Fire Protection: $78,000
General Public Buildings: $77,000
Natural Resources - Other: $50,000
Air Transportation: $13,000
- Federal Intergovernmental - Housing and Community Development: $76,000
- General - Interest on Debt: $435,000
- Intergovernmental to Local - Other - General - Other: $447,000
Other - Public Welfare - Other: $82,000
Other - Parks and Recreation: $35,000
Other - Health - Other: $16,000
- Local Intergovernmental - General Local Government Support: $52,000
Education: $22,000
- Long Term Debt - Beginning Outstanding - Unspecified Public Purpose: $10,866,000
Outstanding Unspecified Public Purpose: $10,147,000
Retired Unspecified Public Purpose: $719,000
- Miscellaneous - General Revenue - Other: $182,000
Interest Earnings: $136,000
Sale of Property: $100,000
Rents: $74,000
Fines and Forfeits: $68,000
Donations From Private Sources: $2,000
- Other Capital Outlay - Regular Highways: $244,000
Elementary and Secondary Education: $163,000
Local Fire Protection: $161,000
Housing and Community Development: $65,000
Solid Waste Management: $12,000
Judicial and Legal Services: $11,000
Financial Administration: $8,000
Police Protection: $8,000
General - Other: $8,000
Central Staff Services: $3,000
Natural Resources - Other: $3,000
Health - Other: $2,000
Correctional Institutions: $1,000
- Other Funds - Cash and Securities: $7,490,000
- Sinking Funds - Cash and Securities: $1,621,000
- State Intergovernmental - Education: $10,301,000
Highways: $2,387,000
Other: $542,000
General Local Government Support: $183,000
- Tax - Property: $2,390,000
General Sales and Gross Receipts: $878,000
Motor Vehicle License: $266,000
Occupation and Business License - Other: $30,000
Other Selective Sales: $29,000
Alcoholic Beverage Sales: $24,000
Public Utility License: $2,000
Other License: $1,000
- Total Salaries and Wages: $7,490,000
Supplemental Security Income (SSI) in 2006:
- Total number of recipients: 277
- Number of aged recipients: 43
- Number of blind and disabled recipients: 234
- Number of recipients under 18: 22
- Number of recipients between 18 and 64: 175
- Number of recipients older than 64: 80
- Number of recipients also receiving OASDI: 133
- Amount of payments (thousands of dollars): 110
| Most common first names in Houston County, TN among deceased individuals | ||
| Name | Count | Lived (average) |
|---|---|---|
| James | 81 | 70.1 years |
| William | 76 | 75.9 years |
| John | 53 | 74.3 years |
| Mary | 52 | 80.3 years |
| Charles | 48 | 69.6 years |
| George | 40 | 78.1 years |
| Robert | 35 | 74.6 years |
| Thomas | 20 | 72.9 years |
| Henry | 20 | 76.2 years |
| Annie | 19 | 82.9 years |
| Most common last names in Houston County, TN among deceased individuals | ||
| Last name | Count | Lived (average) |
|---|---|---|
| Brooks | 37 | 78.3 years |
| Rye | 35 | 76.1 years |
| Lewis | 31 | 77.7 years |
| Smith | 30 | 78.7 years |
| Baggett | 29 | 70.3 years |
| Alsobrooks | 26 | 79.9 years |
| Adams | 25 | 74.2 years |
| Clark | 25 | 78.2 years |
| Black | 23 | 74.2 years |
| Parker | 21 | 77.2 years |
| Businesses in Houston County, TN | ||||
| Name | Count | Name | Count | |
|---|---|---|---|---|
| Ace Hardware | 1 | True Value | 1 | |
| Subway | 1 | U-Haul | 2 | |