Orange County, Virginia (VA)
County owner-occupied free and clear houses and condos in 2010: 2,964
County owner-occupied houses and condos in 2000: 7,825
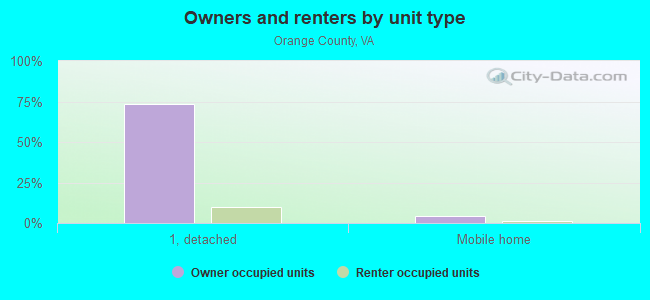
Renter-occupied apartments: 3,005 (it was 2,325 in 2000)
| % of renters here: | 23% |
| State: | 33% |
Land area: 342 sq. mi.
Water area: 1.7 sq. mi.
Population density: 108 people per square mile (average).
Industries providing employment: Educational, health and social services (19.6%), Construction (12.1%), Retail trade (11.7%), Professional, scientific, management, administrative, and waste management services (10.5%).
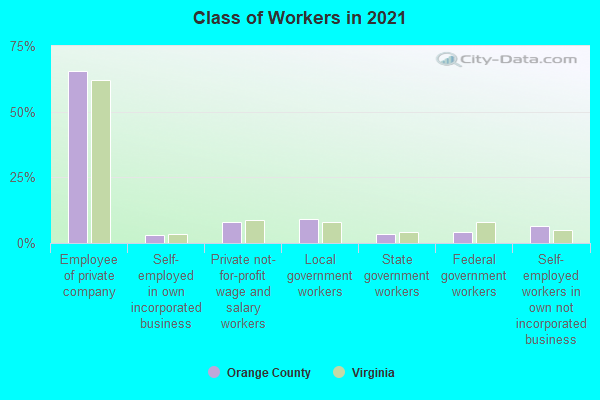
Type of workers:
- Private wage or salary: 74%
- Government: 18%
- Self-employed, not incorporated: 8%
- Unpaid family work: 0%
- OSM Map
- General Map
- Google Map
- MSN Map

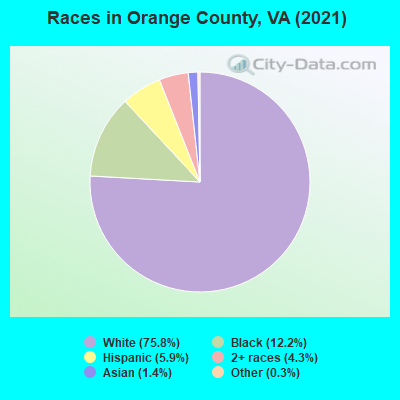
- 27,64475.6%White Non-Hispanic Alone
- 4,43712.1%Black Non-Hispanic Alone
- 2,3096.3%Hispanic or Latino
- 1,4914.1%Two or more races
- 5501.5%Asian alone
- 1070.3%Some other race alone
- 50.01%American Indian and Alaska Native alone
| Median resident age: | 43.1 years |
| Virginia median age: | 39.0 years |
| Males: 18,307 | |
| Females: 18,536 |

 | Where Does The Dc Sprawl Stop (62 replies) |
| New Post Sprawl near Fredericksburg (32 replies) |
| Do you tell people you live in DC? (23 replies) |
| Seeking rural area for occasional commute to DC (18 replies) |
| Credit Card authorizations?? What a disgrace. (24 replies) |
| Census Releases New CDPs for Virginia, 2020-2030 (5 replies) |
| Orange County: | 2.0 people |
| Virginia: | 3 people |
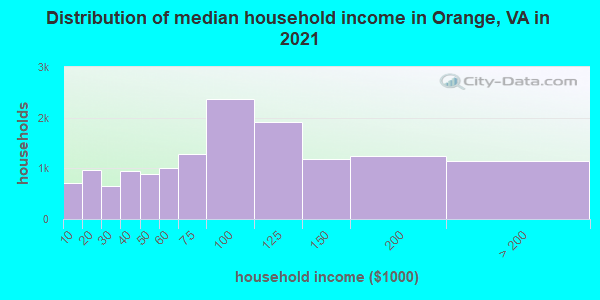
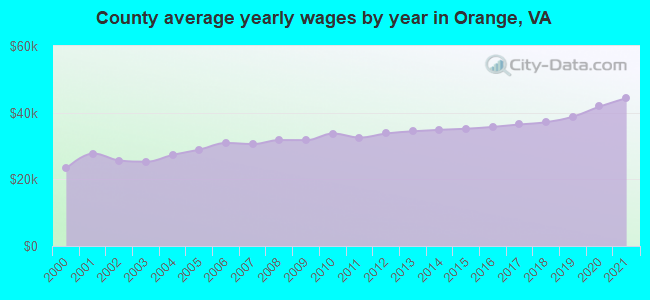
Estimated median household income in 2022: $85,932 ($42,889 in 1999)
| This county: | $85,932 |
| Virginia: | $85,873 |
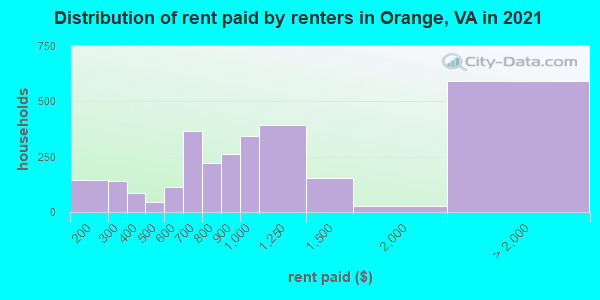
Median contract rent in 2022 for apartments: $913 (lower quartile is $654, upper quartile is $1,202)
| This county: | $913 |
| State: | $1270 |
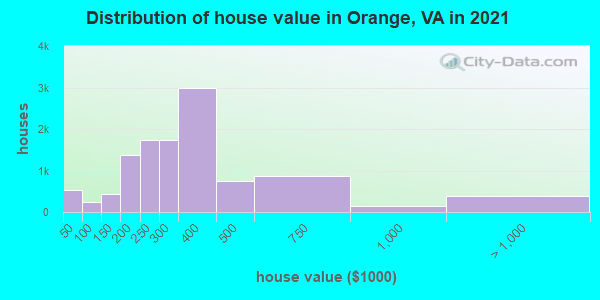
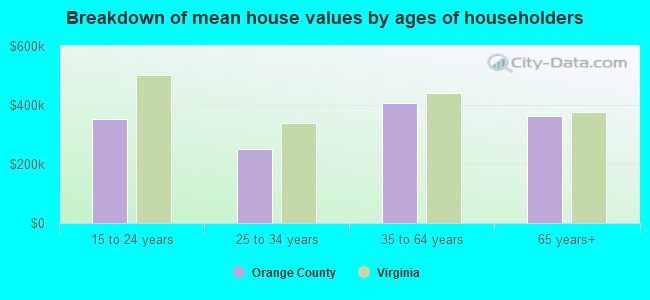
Estimated median house or condo value in 2022: $340,086 (it was $112,800 in 2000)
| Orange: | $340,086 |
| Virginia: | $365,700 |
Median monthly housing costs for homes and condos with a mortgage: $1,667
Median monthly housing costs for units without a mortgage: $505
Institutionalized population: 558
Crime in 2021 (reported by the sheriff's office or county police, not the county total):
- Murders: 2
- Rapes: 14
- Robberies: 1
- Assaults: 27
- Burglaries: 9
- Thefts: 125
- Auto thefts: 12
Crime in 2020 (reported by the sheriff's office or county police, not the county total):
- Murders: 0
- Rapes: 6
- Robberies: 1
- Assaults: 20
- Burglaries: 20
- Thefts: 126
- Auto thefts: 17
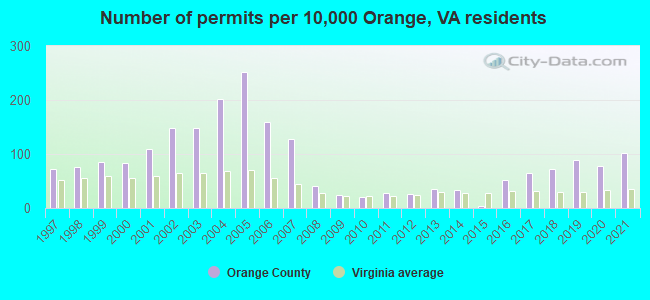
Single-family new house construction building permits:
- 2022: 241 buildings, average cost: $297,300
- 2021: 261 buildings, average cost: $194,800
- 2020: 202 buildings, average cost: $222,200
- 2019: 229 buildings, average cost: $225,300
- 2018: 187 buildings, average cost: $219,200
- 2017: 167 buildings, average cost: $202,700
- 2016: 132 buildings, average cost: $226,100
- 2015: 9 buildings, average cost: $183,300
- 2014: 86 buildings, average cost: $218,900
- 2013: 94 buildings, average cost: $186,300
- 2012: 67 buildings, average cost: $178,900
- 2011: 71 buildings, average cost: $193,200
- 2010: 54 buildings, average cost: $161,900
- 2009: 61 buildings, average cost: $210,000
- 2008: 104 buildings, average cost: $199,800
- 2007: 329 buildings, average cost: $213,700
- 2006: 412 buildings, average cost: $230,800
- 2005: 652 buildings, average cost: $224,900
- 2004: 524 buildings, average cost: $180,100
- 2003: 384 buildings, average cost: $164,700
- 2002: 382 buildings, average cost: $142,800
- 2001: 283 buildings, average cost: $148,800
- 2000: 217 buildings, average cost: $139,700
- 1999: 220 buildings, average cost: $127,600
- 1998: 196 buildings, average cost: $120,200
- 1997: 186 buildings, average cost: $106,100

Median real estate property taxes paid for housing units with mortgages in 2022: $2,001 (0.6%)
Median real estate property taxes paid for housing units with no mortgage in 2022: $1,864 (0.6%)
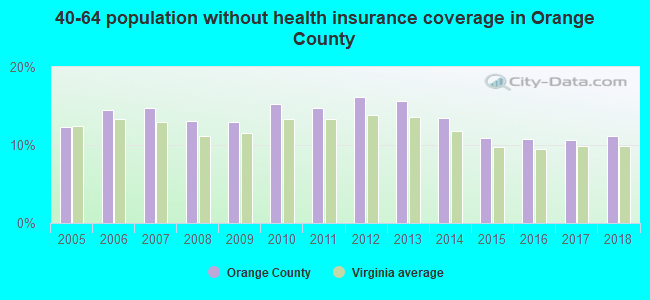
| Orange County: | 13.7% |
| Virginia: | 10.6% |
Median age of residents in 2022: 43.1 years old
(Males: 41.7 years old, Females: 45.7 years old)
(Median age for: White residents: 46.2 years old, Black residents: 42.1 years old, American Indian residents: 58.5 years old, Asian residents: 38.1 years old, Hispanic or Latino residents: 34.3 years old, Other race residents: 38.4 years old)
Fair market rent in 2006 for a 1-bedroom apartment in Orange County is $533 a month.
Fair market rent for a 2-bedroom apartment is $593 a month.
Fair market rent for a 3-bedroom apartment is $863 a month.
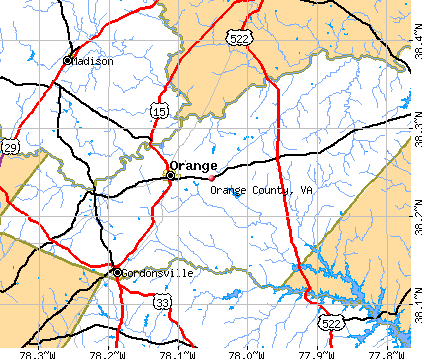
Cities in this county include: Lake of the Woods, Orange, Gordonsville.
Neighboring counties: Allen County, Kansas  , Anderson County, Kansas , Breckinridge County, Kentucky , Somerset County, Maryland
  , Worcester County, Maryland , Cole County, Missouri , Franklin County, Kansas .
| Here: | 2.9% |
| Virginia: | 2.7% |
Current college students: 720
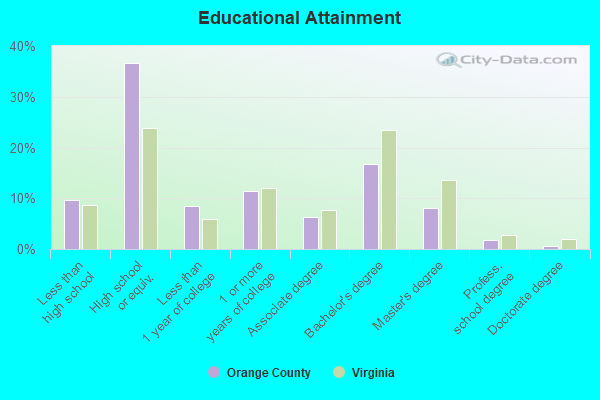
People 25 years of age or older with a high school degree or higher: 89.8%
People 25 years of age or older with a bachelor's degree or higher: 27.3%
Number of foreign born residents: 1,675 (61.1% naturalized citizens)
| Orange County: | 4.5% |
| Whole state: | 12.7% |
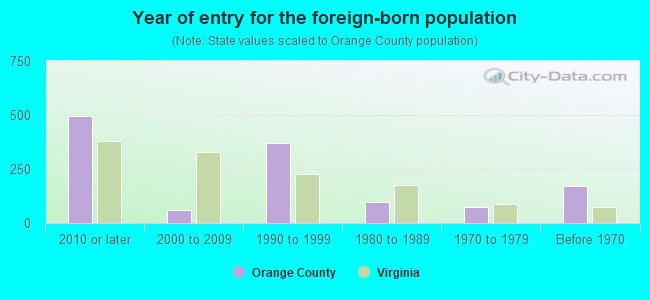
- Year of entry for the foreign-born population
- 5432010 or later
- 1442000 to 2009
- 5021990 to 1999
- 991980 to 1989
- 741970 to 1979
- 173Before 1970
Mean travel time to work (commute): $ minutes
Percentage of county residents living and working in this county: 96.2%
Housing units in structures:
- One, detached: 13,047
- One, attached: 562
- Two: 91
- 3 or 4: 353
- 5 to 9: 387
- 10 to 19: 462
- 20 to 49: 57
- 50 or more: 176
- Mobile homes: 777
Housing units in Orange County with a mortgage: 7,774 (689 second mortgage, 0 home equity loan, 468 both second mortgage and home equity loan)
Houses without a mortgage: 187
| Here: | 3.6% with mortgage |
| State: | 97.2% with mortgage |
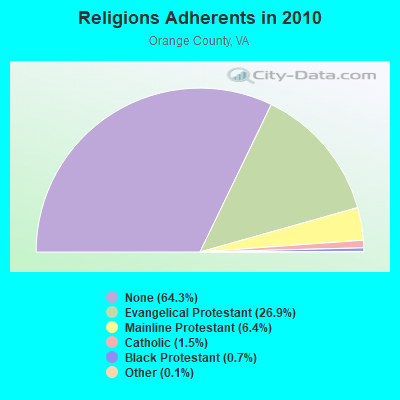
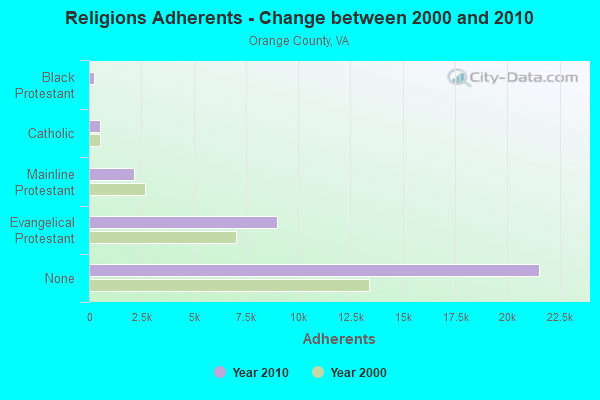
Religion statistics for Orange County
| Religion | Adherents | Congregations |
|---|---|---|
| Evangelical Protestant | 8,998 | 39 |
| Mainline Protestant | 2,152 | 12 |
| Catholic | 513 | 1 |
| Black Protestant | 242 | 1 |
| Other | 42 | 3 |
| None | 21,534 | - |
Source: Clifford Grammich, Kirk Hadaway, Richard Houseal, Dale E.Jones, Alexei Krindatch, Richie Stanley and Richard H.Taylor. 2012. 2010 U.S.Religion Census: Religious Congregations & Membership Study. Association of Statisticians of American Religious Bodies. Jones, Dale E., et al. 2002. Congregations and Membership in the United States 2000. Nashville, TN: Glenmary Research Center.
Food Environment Statistics:
| Orange County: | 1.24 / 10,000 pop. |
| State: | 2.03 / 10,000 pop. |
| This county: | 1.24 / 10,000 pop. |
| Virginia: | 1.43 / 10,000 pop. |
| Orange County: | 4.95 / 10,000 pop. |
| Virginia: | 4.03 / 10,000 pop. |
| This county: | 5.88 / 10,000 pop. |
| State: | 7.65 / 10,000 pop. |
| Orange County: | 9.6% |
| Virginia: | 9.3% |
| Orange County: | 26.6% |
| State: | 26.7% |
| Here: | 16.6% |
| State: | 18.6% |
Agriculture in Orange County:
Average size of farms: 216 acresAverage value of agricultural products sold per farm: $75,693
Average value of crops sold per acre for harvested cropland: $567.00
The value of livestock, poultry, and their products as a percentage of the total market value of agricultural products sold: 47.69%
Average total farm production expenses per farm: $72,067
Harvested cropland as a percentage of land in farms: 32.36%
Irrigated harvested cropland as a percentage of land in farms: 4.52%
Average market value of all machinery and equipment per farm: $52,261
The percentage of farms operated by a family or individual: 85.39%
Average age of principal farm operators: 57 years
Average number of cattle and calves per 100 acres of all land in farms: 22.63
Milk cows as a percentage of all cattle and calves: 7.02%
Corn for grain: 5237 harvested acres
All wheat for grain: 739 harvested acres
Soybeans for beans: 3717 harvested acres
Vegetables: 47 harvested acres
Land in orchards: 293 acres
Earthquake activity:
Orange County-area historical earthquake activity is significantly above Virginia state average. It is 50% smaller than the overall U.S. average.On 8/23/2011 at 17:51:04, a magnitude 5.8 (5.8 MW, Depth: 3.7 mi, Class: Moderate, Intensity: VI - VII) earthquake occurred 23.8 miles away from Orange County center
On 8/25/2011 at 05:07:52, a magnitude 4.5 (4.5 ML, Depth: 4.2 mi, Class: Light, Intensity: IV - V) earthquake occurred 20.9 miles away from the county center
On 12/9/2003 at 20:59:18, a magnitude 4.5 (4.5 ML, Depth: 6.2 mi) earthquake occurred 32.5 miles away from the county center
On 12/9/2003 at 20:59:14, a magnitude 4.5 (4.5 MB, 4.5 LG) earthquake occurred 46.0 miles away from the county center
On 8/9/2020 at 12:07:37, a magnitude 5.1 (5.1 MW, Depth: 4.7 mi) earthquake occurred 207.0 miles away from Orange County center
On 8/24/2011 at 00:04:36, a magnitude 4.2 (4.2 ML) earthquake occurred 23.3 miles away from the county center
Magnitude types: regional Lg-wave magnitude (LG), body-wave magnitude (MB), local magnitude (ML), moment magnitude (MW)
Most recent natural disasters:
- Virginia Covid-19 Pandemic, Incident Period: January 20, 2020, Major Disaster (Presidential) Declared DR-4512-VA: April 2, 2020, FEMA Id: 4512, Natural disaster type: Other
- Virginia Hurricane Sandy, Incident Period: October 26, 2012 to November 01, 2012, Emergency Declared EM-3359: October 29, 2012, FEMA Id: 3359, Natural disaster type: Hurricane
- Virginia Severe Storms and Straight-line Winds, Incident Period: June 29, 2012 to July 01, 2012, Major Disaster (Presidential) Declared DR-4072: July 27, 2012, FEMA Id: 4072, Natural disaster type: Storm, Wind
- Virginia Earthquake, Incident Period: August 23, 2011 to October 25, 2011, Major Disaster (Presidential) Declared DR-4042: November 04, 2011, FEMA Id: 4042, Natural disaster type: Earthquake
- Virginia Severe Winter Storms and Snowstorms, Incident Period: February 05, 2010 to February 11, 2010, Major Disaster (Presidential) Declared DR-1905: April 27, 2010, FEMA Id: 1905, Natural disaster type: Snowstorm, Winter Storm
- Virginia Severe Winter Storm and Snowstorm, Incident Period: December 18, 2009 to December 20, 2009, Major Disaster (Presidential) Declared DR-1874: February 16, 2010, FEMA Id: 1874, Natural disaster type: Snowstorm, Winter Storm
- Virginia Hurricane Katrina Evacuation, Incident Period: August 29, 2005 to October 01, 2005, Emergency Declared EM-3240: September 12, 2005, FEMA Id: 3240, Natural disaster type: Hurricane
- Virginia Hurricane Isabel, Incident Period: September 18, 2003 to October 01, 2003, Major Disaster (Presidential) Declared DR-1491: September 18, 2003, FEMA Id: 1491, Natural disaster type: Hurricane
- Virginia Winter Storm, Incident Period: January 25, 2000 to January 30, 2000, Major Disaster (Presidential) Declared DR-1318: February 28, 2000, FEMA Id: 1318, Natural disaster type: Winter Storm
- Virginia Hurricane Fran, Incident Period: September 05, 1996 to September 23, 1996, Major Disaster (Presidential) Declared DR-1135: September 06, 1996, FEMA Id: 1135, Natural disaster type: Hurricane
- 7 other natural disasters have been reported since 1953.
The number of natural disasters in Orange County (17) is near the US average (15).
Major Disasters (Presidential) Declared: 13
Emergencies Declared: 4
Causes of natural disasters: Winter Storms: 5, Hurricanes: 4, Storms: 4, Floods: 2, Snowstorms: 2, Blizzard: 1, Drought: 1, Earthquake: 1, Ice Storm: 1, Tropical Storm: 1, Wind: 1, Other: 1 (Note: some incidents may be assigned to more than one category).
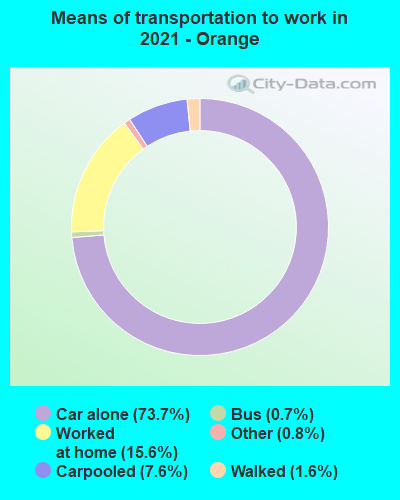
Means of transportation to work:
- Drove a car alone: 7,219 (65.8%)
- Carpooled: 900 (8.2%)
- Bus: 36 (0.3%)
- Subway or elevated rail: 36 (0.3%)
- Taxicab, motorcycle, or other means: 145 (1.3%)
- Walked: 130 (1.2%)
- Worked at home: 2,719 (24.8%)
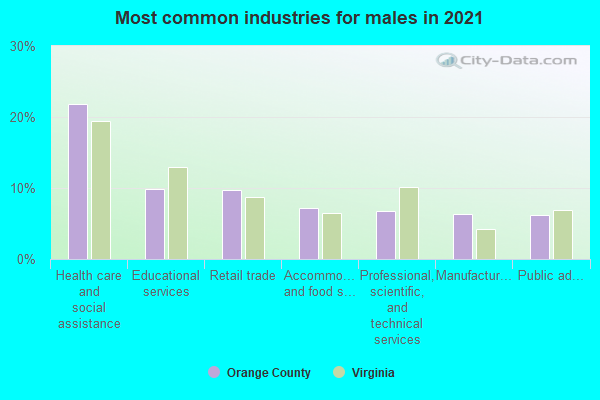
- Health care and social assistance (20%)
- Retail trade (11%)
- Educational services (10%)
- Other services, except public administration (7%)
- Professional, scientific, and technical services (7%)
- Public administration (6%)
- Accommodation and food services (6%)

- Health care and social assistance (22%)
- Retail trade (12%)
- Educational services (11%)
- Other services, except public administration (8%)
- Professional, scientific, and technical services (7%)
- Public administration (6%)
- Accommodation and food services (6%)

- Management occupations (14%)
- Construction and extraction occupations (13%)
- Installation, maintenance, and repair occupations (10%)
- Sales and related occupations (8%)
- Production occupations (6%)
- Computer and mathematical occupations (5%)
- Transportation occupations (4%)
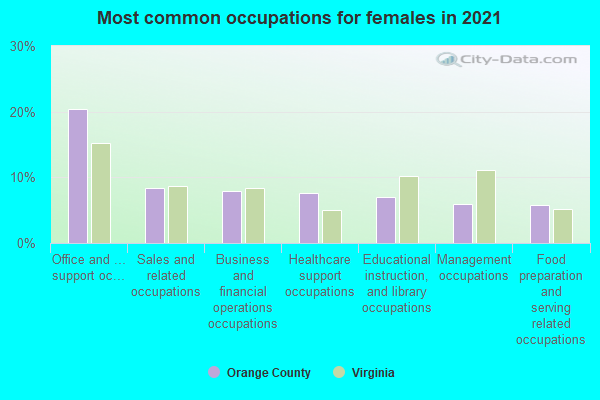
- Office and administrative support occupations (19%)
- Business and financial operations occupations (10%)
- Sales and related occupations (9%)
- Management occupations (9%)
- Healthcare support occupations (7%)
- Educational instruction, and library occupations (7%)
- Food preparation and serving related occupations (6%)

- Mexico (21%)
- Belarus (11%)
- Philippines (8%)
- China, excluding Hong Kong and Taiwan (8%)
- Korea (7%)
- France (5%)
- Kenya (4%)
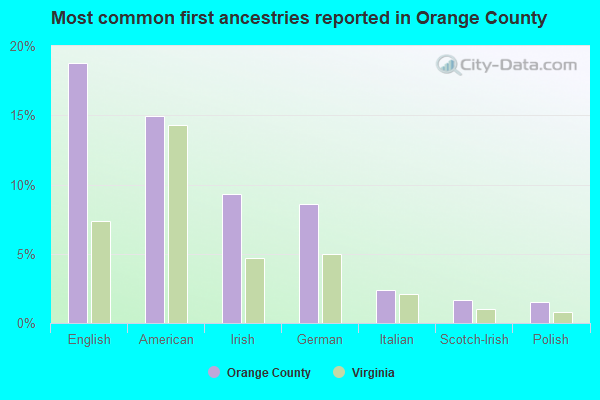
- English (18%)
- American (12%)
- Irish (11%)
- German (8%)
- Scottish (2%)
- Italian (2%)
- Scotch-Irish (2%)
People in group quarters in Orange County, Virginia in 2010:
- 379 people in local jails and other municipal confinement facilities
- 179 people in nursing facilities/skilled-nursing facilities
- 26 people in emergency and transitional shelters (with sleeping facilities) for people experiencing homelessness
- 13 people in workers' group living quarters and job corps centers
- 4 people in group homes intended for adults
People in group quarters in Orange County, Virginia in 2000:
- 236 people in local jails and other confinement facilities (including police lockups)
- 199 people in nursing homes
- 44 people in other noninstitutional group quarters
- 8 people in homes for the mentally retarded
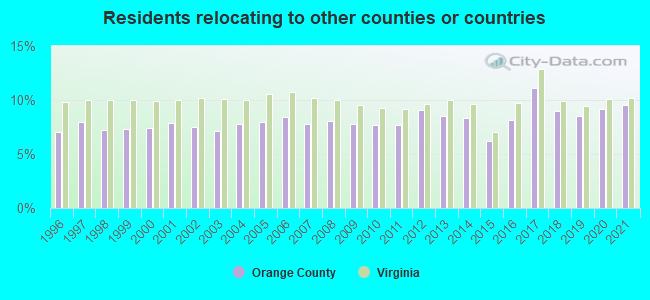
11.18% of this county's 2021 resident taxpayers lived in other counties in 2020 ($69,843 average adjusted gross income)
| Here: | 11.18% |
| Virginia average: | 10.16% |
10 or fewer of this county's residents moved from foreign countries.
8.77% relocated from other counties in Virginia ($52,558 average AGI)
2.41% relocated from other states ($17,285 average AGI)
Orange County: 2.41% Virginia average: 3.91%

Top counties from which taxpayers relocated into this county between 2020 and 2021:
| from Spotsylvania County, VA | |
| from Culpeper County, VA | |
| from Prince William County, VA | |
| from Stafford County, VA | |
| from Albemarle County, VA | |
| from Fairfax County, VA | |
| from Louisa County, VA |
9.57% of this county's 2020 resident taxpayers moved to other counties in 2021 ($59,866 average adjusted gross income)
| Here: | 9.57% |
| Virginia average: | 10.20% |
10 or fewer of this county's residents moved to foreign countries.
7.06% relocated to other counties in Virginia ($43,357 average AGI)
2.51% relocated to other states ($16,508 average AGI)
Orange County: 2.51% Virginia average: 3.98%
Top counties to which taxpayers relocated from this county between 2020 and 2021:
| to Spotsylvania County, VA | |
| to Louisa County, VA | |
| to Culpeper County, VA | |
| to Albemarle County, VA | |
| to Fredericksburg city, VA | |
| to Stafford County, VA | |
| to Greene County, VA |
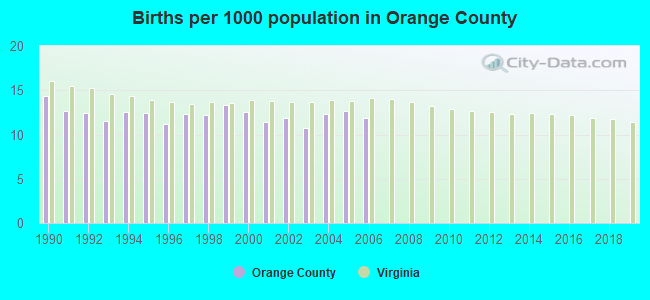
Births per 1000 population from 1990 to 1999: 12.5
Births per 1000 population from 2000 to 2006: 11.9
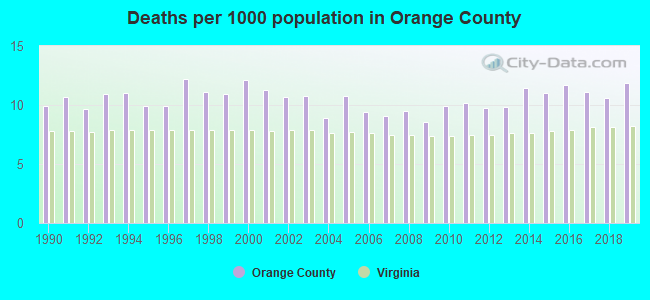
Deaths per 1000 population from 1990 to 1999: 10.6
Deaths per 1000 population from 2000 to 2009: 10.1
Deaths per 1000 population from 2010 to 2020: 10.8
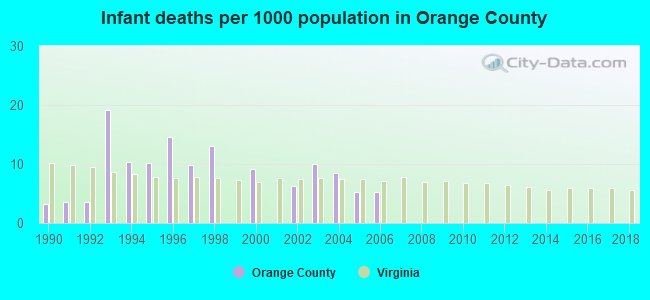
Infant deaths per 1000 live births from 1990 to 1999: 8.8
Infant deaths per 1000 live births from 2000 to 2006: 6.3
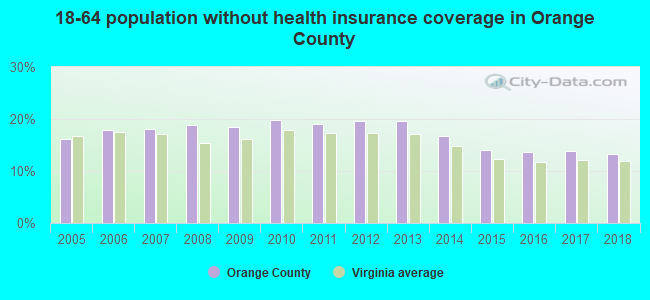
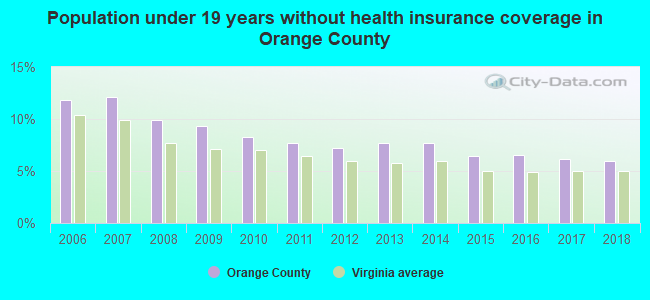
Persons under 19 years old without health insurance coverage in 2018: 6.0%
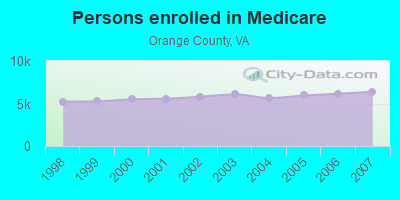
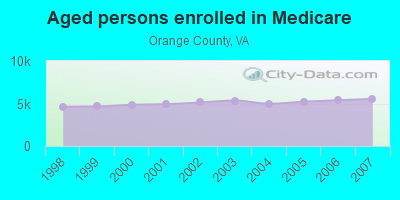
Persons enrolled in hospital insurance and/or supplemental medical insurance (Medicare) in July 1, 2007: 6,387 (5,549 aged, 838 disabled)
Children under 18 without health insurance coverage in 2007: 857 (11%)

Most common underlying causes of death in Orange County, Virginia in 1999 - 2019:
- Bronchus or lung, unspecified - Malignant neoplasms (472)
- Acute myocardial infarction, unspecified (455)
- Unspecified dementia (253)
- Chronic obstructive pulmonary disease, unspecified (247)
- Atherosclerotic heart disease (229)
- Stroke, not specified as haemorrhage or infarction (185)
- Alzheimer disease, unspecified (162)
- Congestive heart failure (131)
- Septicaemia, unspecified (66)
- Pneumonia, unspecified (43)
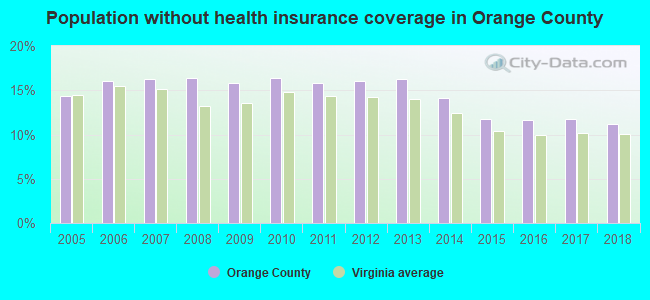
Population without health insurance coverage in 2000: 10%
Children under 18 without health insurance coverage in 2000: 8%
Medical specialist MDs per 100,000 population in 2005: 820
Dentists per 100,000 population in 1998: 10
Total births per 100,000 population, July 2005 - July 2006 : 20
Total deaths per 100,000 population, July 2005 - July 2006: 93
Limited-service eating places per 100,000 population in 2005 : 13
Suicides per 1,000,000 population from 2000 to 2006: 131.5. This is more than state average.
Household type by relationship:
Households: 36,843- Male householders: 7,595 (1,773 living alone), Female householders: 7,104 (1,829 living alone)
7,787 spouses (7,718 opposite-sex spouses), 1,514 unmarried partners, (1,465 opposite-sex unmarried partners), 9,196 children (8,491 natural, 172 adopted, 532 stepchildren), 1,517 grandchildren, 240 brothers or sisters, 543 parents, 0 foster children, 440 other relatives, 400 non-relatives
- In group quarters: 580
Size of family households: 4,757 2-persons, 1,997 3-persons, 1,845 4-persons, 1,049 5-persons, 499 6-persons, 116 7-or-more-persons.
Size of nonfamily households: 3,601 1-person, 781 2-persons, 50 3-persons.
4,338 married couples with children.
1,798 single-parent households (356 men, 1,442 women).
93.3% of residents of Orange speak English at home.
3.4% of residents speak Spanish at home (67% speak English very well, 22% speak English well, 11% speak English not well).
2.8% of residents speak other Indo-European language at home (58% speak English very well, 35% speak English well, 1% speak English not well, 5% don't speak English at all).
0.3% of residents speak Asian or Pacific Island language at home (19% speak English very well, 61% speak English well, 20% speak English not well).
0.2% of residents speak other language at home (81% speak English very well, 19% speak English well).
In fiscal year 2004:
Federal Government expenditure: $181,916,000 ($6,279 per capita)
Department of Defense expenditure: $15,806,000
Federal direct payments to individuals for retirement and disability: $120,777,000
Federal other direct payments to individuals: $33,685,000
Federal direct payments not to individuals: $673,000
Federal grants: $21,360,000
Federal procurement contracts: $1,477,000 ($434,000 Department of Defense)
Federal salaries and wages: $3,944,000 ($0,000 Department of Defense)
Federal Government direct loans: $1,685,000
Federal guaranteed/insured loans: $18,550,000
Federal Government insurance: $8,839,000
Population change from April 1, 2000 to July 1, 2005:
Births: 1,628| Here: | 54 per 1000 residents |
| State: | 70 per 1000 residents |
Deaths: 1,589
| Here: | 53 per 1000 residents |
| State: | 40 per 1000 residents |
Net international migration: +91
| Here: | +3 per 1000 residents |
| State: | +18 per 1000 residents |
Net internal migration: +4,295
| Here: | +142 per 1000 residents |
| State: | +14 per 1000 residents |
Total withdrawal of fresh water for public supply: 0.45 millions of gallons per day (4% from ground, 96% from surface)
| Here: | 6.9 |
| State: | 7.0 |
| Here: | 4.6 |
| State: | 4.3 |
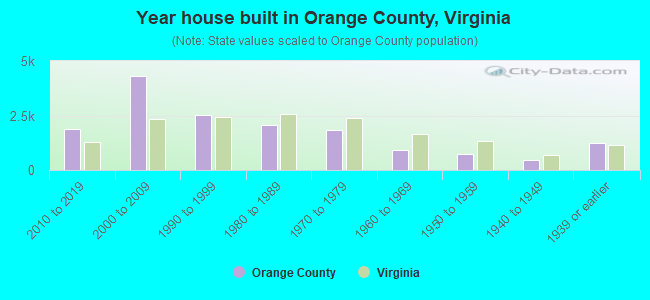
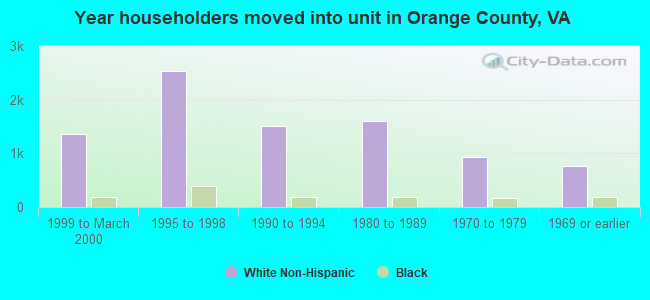
- Year house built in Orange County, Virginia
- 352020 or later
- 2,1322010 to 2019
- 4,2552000 to 2009
- 2,1861990 to 1999
- 2,2501980 to 1989
- 1,5681970 to 1979
- 1,0041960 to 1969
- 8561950 to 1959
- 4671940 to 1949
- 1,2961939 or earlier
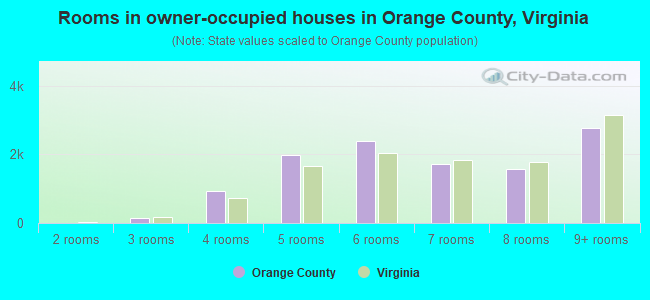
- Rooms in owner-occupied houses in Orange County, Virginia
- 01 room
- 02 rooms
- 1083 rooms
- 8244 rooms
- 1,7815 rooms
- 2,3696 rooms
- 1,8547 rooms
- 1,5588 rooms
- 3,1089+ rooms
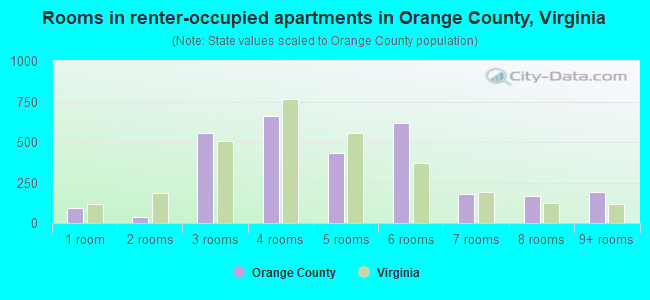
- Rooms in renter-occupied apartments in Orange County, Virginia
- 1121 room
- 282 rooms
- 6033 rooms
- 7354 rooms
- 4935 rooms
- 6606 rooms
- 2397 rooms
- 1618 rooms
- 719+ rooms

- Bedrooms in owner-occupied houses in Orange County, Virginia
- 0no bedroom
- 541 bedroom
- 1,0482 bedrooms
- 6,4523 bedrooms
- 2,9914 bedrooms
- 1,0685+ bedrooms
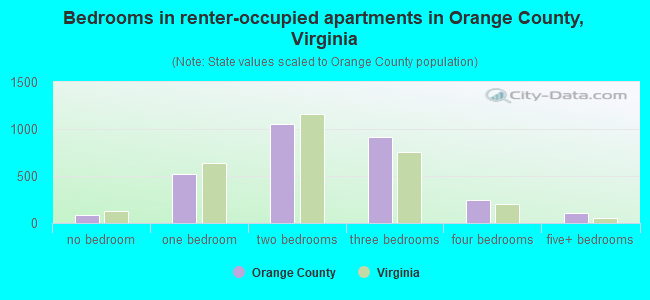
- Bedrooms in renter-occupied apartments in Orange County, Virginia
- 113no bedroom
- 4991 bedroom
- 1,3632 bedrooms
- 9633 bedrooms
- 1454 bedrooms
- 385+ bedrooms
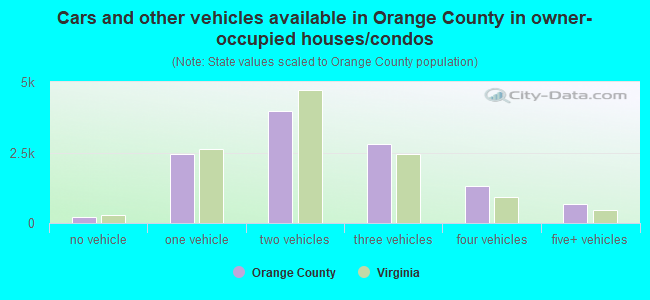
- Cars and other vehicles available in Orange County in owner-occupied houses/condos
- 295no vehicle
- 2,3661 vehicle
- 4,0582 vehicles
- 2,7663 vehicles
- 1,3024 vehicles
- 7855+ vehicles
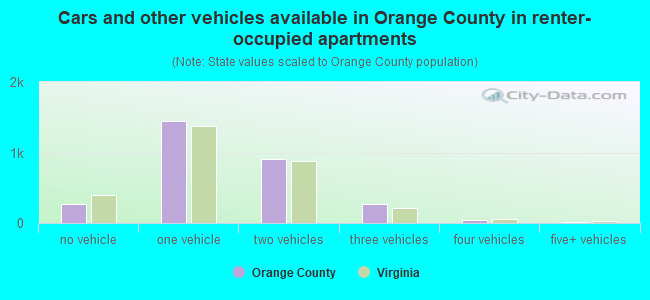
- Cars and other vehicles available in Orange County in renter-occupied apartments
- 283no vehicle
- 1,3821 vehicle
- 9552 vehicles
- 4433 vehicles
- 424 vehicles
- 105+ vehicles
87.5% of Orange County residents lived in the same house 1 years ago.
Out of people who lived in different houses, 25% lived in this county.
Out of people who lived in different counties, 63% lived in Virginia.
| Orange County: | 87.5% |
| State average: | 86.6% |
Place of birth for U.S.-born residents:
- This state: 19,943
- Other state: 14,725
- Northeast: 4,955
- Midwest: 2,400
- South: 6,292
- West: 1,039
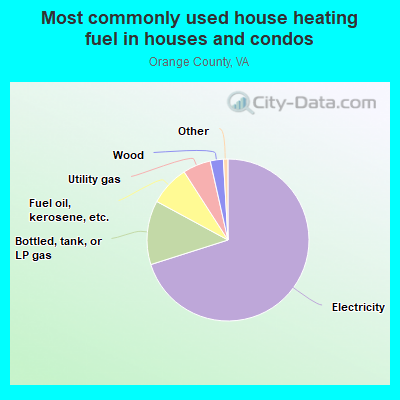
- 70.4%Electricity
- 10.8%Bottled, tank, or LP gas
- 7.9%Fuel oil, kerosene, etc.
- 6.7%Utility gas
- 3.5%Wood
- 0.4%No fuel used
- 0.1%Coal or coke
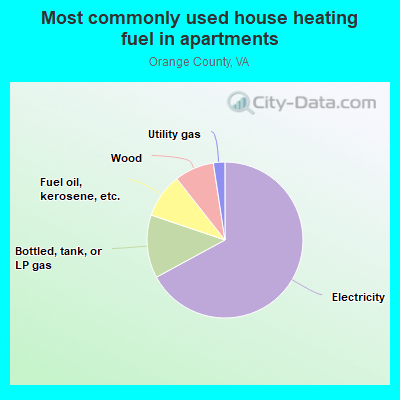
- 65.8%Electricity
- 15.6%Bottled, tank, or LP gas
- 7.7%Fuel oil, kerosene, etc.
- 7.2%Wood
- 3.4%Utility gas
- 0.3%No fuel used
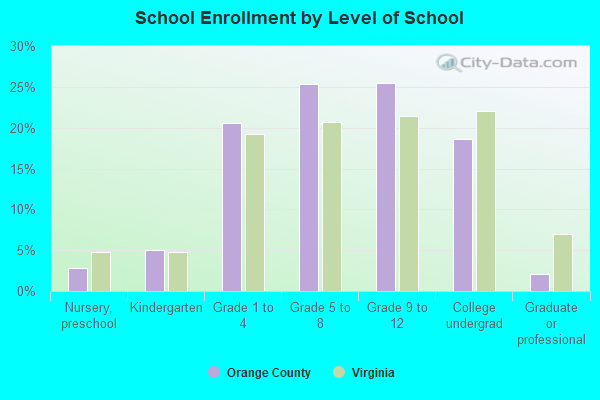
Private vs. public school enrollment:
| Here: | 17.0% |
| Virginia: | 13.2% |
| Here: | 11.4% |
| Virginia: | 10.2% |
| Here: | 20.0% |
| Virginia: | 18.7% |
Orange County government finances - Expenditure in 2018:
- Bond Funds - Cash and Securities: $39,043,000
Cash and Securities: $33,356,000
- Charges - Other: $2,065,000
Other: $2,028,000
Elementary and Secondary Education School Lunch: $769,000
Elementary and Secondary Education School Lunch: $756,000
Solid Waste Management: $520,000
Solid Waste Management: $511,000
Air Transportation: $305,000
Air Transportation: $300,000
Elementary and Secondary Education School Tuition and Transportation: $17,000
Elementary and Secondary Education - Other: $14,000
Elementary and Secondary Education - Other: $12,000
Elementary and Secondary Education School Tuition and Transportation: $10,000
- Construction - Elementary and Secondary Education: $3,198,000
General - Other: $3,080,000
Elementary and Secondary Education: $3,039,000
General - Other: $2,927,000
Air Transportation: $224,000
Air Transportation: $213,000
- Current Operations - Elementary and Secondary Education: $59,178,000
Elementary and Secondary Education: $54,451,000
Public Welfare - Other: $7,398,000
Public Welfare - Other: $6,807,000
Police Protection: $6,465,000
Police Protection: $5,949,000
Local Fire Protection: $5,700,000
Local Fire Protection: $5,245,000
Solid Waste Management: $2,502,000
Solid Waste Management: $2,302,000
Central Staff Services: $2,103,000
Central Staff Services: $1,935,000
Judicial and Legal Services: $1,883,000
Judicial and Legal Services: $1,732,000
Housing and Community Development: $1,250,000
Housing and Community Development: $1,150,000
Regular Highways: $1,102,000
Parks and Recreation: $1,023,000
Regular Highways: $1,014,000
Parks and Recreation: $941,000
Health - Other: $727,000
Financial Administration: $679,000
Health - Other: $669,000
Financial Administration: $625,000
Protective Inspection and Regulation - Other: $507,000
Protective Inspection and Regulation - Other: $467,000
General Public Buildings: $453,000
General Public Buildings: $417,000
Air Transportation: $410,000
Air Transportation: $377,000
Libraries: $360,000
General - Other: $350,000
Libraries: $331,000
General - Other: $322,000
- Federal Intergovernmental - Education: $2,775,000
Education: $2,160,000
Public Welfare: $1,861,000
Public Welfare: $1,448,000
General Local Government Support: $2,000
General Local Government Support: $2,000
- General - Interest on Debt: $3,941,000
Interest on Debt: $1,123,000
- Intergovernmental to Local - Other - Elementary and Secondary Education: $1,193,000
Other - Elementary and Secondary Education: $1,168,000
- Local Intergovernmental - Education: $2,935,000
Education: $2,704,000
Other: $379,000
Other: $349,000
- Long Term Debt - Beginning Outstanding - Unspecified Public Purpose: $87,619,000
Outstanding Unspecified Public Purpose: $57,850,000
Retired Unspecified Public Purpose: $29,769,000
Beginning Outstanding - Unspecified Public Purpose: $28,081,000
Retired Unspecified Public Purpose: $28,081,000
- Miscellaneous - General Revenue - Other: $2,166,000
General Revenue - Other: $1,741,000
Interest Earnings: $490,000
Interest Earnings: $394,000
Fines and Forfeits: $306,000
Fines and Forfeits: $246,000
Donations From Private Sources: $13,000
Donations From Private Sources: $10,000
Sale of Property: $7,000
Sale of Property: $4,000
- Other Capital Outlay - Elementary and Secondary Education: $2,284,000
Elementary and Secondary Education: $2,208,000
General - Other: $669,000
General - Other: $646,000
- Other Funds - Cash and Securities: $48,874,000
Cash and Securities: $41,755,000
- Sinking Funds - Cash and Securities: $1,330,000
Cash and Securities: $1,136,000
- State Intergovernmental - Education: $33,685,000
Education: $31,801,000
Other: $5,010,000
Other: $4,742,000
General Local Government Support: $3,493,000
General Local Government Support: $3,306,000
Public Welfare: $2,205,000
Public Welfare: $2,087,000
- Tax - Property: $45,524,000
Property: $42,134,000
Other Selective Sales: $7,252,000
Other Selective Sales: $6,712,000
Motor Vehicle License: $1,217,000
Motor Vehicle License: $1,127,000
Other License: $490,000
Other License: $453,000
- Total Salaries and Wages: $35,361,000
: $33,201,000
Orange County government finances - Revenue in 2018:
- Bond Funds - Cash and Securities: $39,043,000
Cash and Securities: $33,356,000
- Charges - Other: $2,065,000
Other: $2,028,000
Elementary and Secondary Education School Lunch: $769,000
Elementary and Secondary Education School Lunch: $756,000
Solid Waste Management: $520,000
Solid Waste Management: $511,000
Air Transportation: $305,000
Air Transportation: $300,000
Elementary and Secondary Education School Tuition and Transportation: $17,000
Elementary and Secondary Education - Other: $14,000
Elementary and Secondary Education - Other: $12,000
Elementary and Secondary Education School Tuition and Transportation: $10,000
- Construction - Elementary and Secondary Education: $3,198,000
General - Other: $3,080,000
Elementary and Secondary Education: $3,039,000
General - Other: $2,927,000
Air Transportation: $224,000
Air Transportation: $213,000
- Current Operations - Elementary and Secondary Education: $59,178,000
Elementary and Secondary Education: $54,451,000
Public Welfare - Other: $7,398,000
Public Welfare - Other: $6,807,000
Police Protection: $6,465,000
Police Protection: $5,949,000
Local Fire Protection: $5,700,000
Local Fire Protection: $5,245,000
Solid Waste Management: $2,502,000
Solid Waste Management: $2,302,000
Central Staff Services: $2,103,000
Central Staff Services: $1,935,000
Judicial and Legal Services: $1,883,000
Judicial and Legal Services: $1,732,000
Housing and Community Development: $1,250,000
Housing and Community Development: $1,150,000
Regular Highways: $1,102,000
Parks and Recreation: $1,023,000
Regular Highways: $1,014,000
Parks and Recreation: $941,000
Health - Other: $727,000
Financial Administration: $679,000
Health - Other: $669,000
Financial Administration: $625,000
Protective Inspection and Regulation - Other: $507,000
Protective Inspection and Regulation - Other: $467,000
General Public Buildings: $453,000
General Public Buildings: $417,000
Air Transportation: $410,000
Air Transportation: $377,000
Libraries: $360,000
General - Other: $350,000
Libraries: $331,000
General - Other: $322,000
- Federal Intergovernmental - Education: $2,775,000
Education: $2,160,000
Public Welfare: $1,861,000
Public Welfare: $1,448,000
General Local Government Support: $2,000
General Local Government Support: $2,000
- General - Interest on Debt: $3,941,000
Interest on Debt: $1,123,000
- Intergovernmental to Local - Other - Elementary and Secondary Education: $1,193,000
Other - Elementary and Secondary Education: $1,168,000
- Local Intergovernmental - Education: $2,935,000
Education: $2,704,000
Other: $379,000
Other: $349,000
- Long Term Debt - Beginning Outstanding - Unspecified Public Purpose: $87,619,000
Outstanding Unspecified Public Purpose: $57,850,000
Retired Unspecified Public Purpose: $29,769,000
Beginning Outstanding - Unspecified Public Purpose: $28,081,000
Retired Unspecified Public Purpose: $28,081,000
- Miscellaneous - General Revenue - Other: $2,166,000
General Revenue - Other: $1,741,000
Interest Earnings: $490,000
Interest Earnings: $394,000
Fines and Forfeits: $306,000
Fines and Forfeits: $246,000
Donations From Private Sources: $13,000
Donations From Private Sources: $10,000
Sale of Property: $7,000
Sale of Property: $4,000
- Other Capital Outlay - Elementary and Secondary Education: $2,284,000
Elementary and Secondary Education: $2,208,000
General - Other: $669,000
General - Other: $646,000
- Other Funds - Cash and Securities: $48,874,000
Cash and Securities: $41,755,000
- Sinking Funds - Cash and Securities: $1,330,000
Cash and Securities: $1,136,000
- State Intergovernmental - Education: $33,685,000
Education: $31,801,000
Other: $5,010,000
Other: $4,742,000
General Local Government Support: $3,493,000
General Local Government Support: $3,306,000
Public Welfare: $2,205,000
Public Welfare: $2,087,000
- Tax - Property: $45,524,000
Property: $42,134,000
Other Selective Sales: $7,252,000
Other Selective Sales: $6,712,000
Motor Vehicle License: $1,217,000
Motor Vehicle License: $1,127,000
Other License: $490,000
Other License: $453,000
- Total Salaries and Wages: $35,361,000
: $33,201,000
Orange County government finances - Debt in 2018:
- Bond Funds - Cash and Securities: $39,043,000
Cash and Securities: $33,356,000
- Charges - Other: $2,065,000
Other: $2,028,000
Elementary and Secondary Education School Lunch: $769,000
Elementary and Secondary Education School Lunch: $756,000
Solid Waste Management: $520,000
Solid Waste Management: $511,000
Air Transportation: $305,000
Air Transportation: $300,000
Elementary and Secondary Education School Tuition and Transportation: $17,000
Elementary and Secondary Education - Other: $14,000
Elementary and Secondary Education - Other: $12,000
Elementary and Secondary Education School Tuition and Transportation: $10,000
- Construction - Elementary and Secondary Education: $3,198,000
General - Other: $3,080,000
Elementary and Secondary Education: $3,039,000
General - Other: $2,927,000
Air Transportation: $224,000
Air Transportation: $213,000
- Current Operations - Elementary and Secondary Education: $59,178,000
Elementary and Secondary Education: $54,451,000
Public Welfare - Other: $7,398,000
Public Welfare - Other: $6,807,000
Police Protection: $6,465,000
Police Protection: $5,949,000
Local Fire Protection: $5,700,000
Local Fire Protection: $5,245,000
Solid Waste Management: $2,502,000
Solid Waste Management: $2,302,000
Central Staff Services: $2,103,000
Central Staff Services: $1,935,000
Judicial and Legal Services: $1,883,000
Judicial and Legal Services: $1,732,000
Housing and Community Development: $1,250,000
Housing and Community Development: $1,150,000
Regular Highways: $1,102,000
Parks and Recreation: $1,023,000
Regular Highways: $1,014,000
Parks and Recreation: $941,000
Health - Other: $727,000
Financial Administration: $679,000
Health - Other: $669,000
Financial Administration: $625,000
Protective Inspection and Regulation - Other: $507,000
Protective Inspection and Regulation - Other: $467,000
General Public Buildings: $453,000
General Public Buildings: $417,000
Air Transportation: $410,000
Air Transportation: $377,000
Libraries: $360,000
General - Other: $350,000
Libraries: $331,000
General - Other: $322,000
- Federal Intergovernmental - Education: $2,775,000
Education: $2,160,000
Public Welfare: $1,861,000
Public Welfare: $1,448,000
General Local Government Support: $2,000
General Local Government Support: $2,000
- General - Interest on Debt: $3,941,000
Interest on Debt: $1,123,000
- Intergovernmental to Local - Other - Elementary and Secondary Education: $1,193,000
Other - Elementary and Secondary Education: $1,168,000
- Local Intergovernmental - Education: $2,935,000
Education: $2,704,000
Other: $379,000
Other: $349,000
- Long Term Debt - Beginning Outstanding - Unspecified Public Purpose: $87,619,000
Outstanding Unspecified Public Purpose: $57,850,000
Retired Unspecified Public Purpose: $29,769,000
Beginning Outstanding - Unspecified Public Purpose: $28,081,000
Retired Unspecified Public Purpose: $28,081,000
- Miscellaneous - General Revenue - Other: $2,166,000
General Revenue - Other: $1,741,000
Interest Earnings: $490,000
Interest Earnings: $394,000
Fines and Forfeits: $306,000
Fines and Forfeits: $246,000
Donations From Private Sources: $13,000
Donations From Private Sources: $10,000
Sale of Property: $7,000
Sale of Property: $4,000
- Other Capital Outlay - Elementary and Secondary Education: $2,284,000
Elementary and Secondary Education: $2,208,000
General - Other: $669,000
General - Other: $646,000
- Other Funds - Cash and Securities: $48,874,000
Cash and Securities: $41,755,000
- Sinking Funds - Cash and Securities: $1,330,000
Cash and Securities: $1,136,000
- State Intergovernmental - Education: $33,685,000
Education: $31,801,000
Other: $5,010,000
Other: $4,742,000
General Local Government Support: $3,493,000
General Local Government Support: $3,306,000
Public Welfare: $2,205,000
Public Welfare: $2,087,000
- Tax - Property: $45,524,000
Property: $42,134,000
Other Selective Sales: $7,252,000
Other Selective Sales: $6,712,000
Motor Vehicle License: $1,217,000
Motor Vehicle License: $1,127,000
Other License: $490,000
Other License: $453,000
- Total Salaries and Wages: $35,361,000
: $33,201,000
Orange County government finances - Cash and Securities in 2018:
- Bond Funds - Cash and Securities: $39,043,000
Cash and Securities: $33,356,000
- Charges - Other: $2,065,000
Other: $2,028,000
Elementary and Secondary Education School Lunch: $769,000
Elementary and Secondary Education School Lunch: $756,000
Solid Waste Management: $520,000
Solid Waste Management: $511,000
Air Transportation: $305,000
Air Transportation: $300,000
Elementary and Secondary Education School Tuition and Transportation: $17,000
Elementary and Secondary Education - Other: $14,000
Elementary and Secondary Education - Other: $12,000
Elementary and Secondary Education School Tuition and Transportation: $10,000
- Construction - Elementary and Secondary Education: $3,198,000
General - Other: $3,080,000
Elementary and Secondary Education: $3,039,000
General - Other: $2,927,000
Air Transportation: $224,000
Air Transportation: $213,000
- Current Operations - Elementary and Secondary Education: $59,178,000
Elementary and Secondary Education: $54,451,000
Public Welfare - Other: $7,398,000
Public Welfare - Other: $6,807,000
Police Protection: $6,465,000
Police Protection: $5,949,000
Local Fire Protection: $5,700,000
Local Fire Protection: $5,245,000
Solid Waste Management: $2,502,000
Solid Waste Management: $2,302,000
Central Staff Services: $2,103,000
Central Staff Services: $1,935,000
Judicial and Legal Services: $1,883,000
Judicial and Legal Services: $1,732,000
Housing and Community Development: $1,250,000
Housing and Community Development: $1,150,000
Regular Highways: $1,102,000
Parks and Recreation: $1,023,000
Regular Highways: $1,014,000
Parks and Recreation: $941,000
Health - Other: $727,000
Financial Administration: $679,000
Health - Other: $669,000
Financial Administration: $625,000
Protective Inspection and Regulation - Other: $507,000
Protective Inspection and Regulation - Other: $467,000
General Public Buildings: $453,000
General Public Buildings: $417,000
Air Transportation: $410,000
Air Transportation: $377,000
Libraries: $360,000
General - Other: $350,000
Libraries: $331,000
General - Other: $322,000
- Federal Intergovernmental - Education: $2,775,000
Education: $2,160,000
Public Welfare: $1,861,000
Public Welfare: $1,448,000
General Local Government Support: $2,000
General Local Government Support: $2,000
- General - Interest on Debt: $3,941,000
Interest on Debt: $1,123,000
- Intergovernmental to Local - Other - Elementary and Secondary Education: $1,193,000
Other - Elementary and Secondary Education: $1,168,000
- Local Intergovernmental - Education: $2,935,000
Education: $2,704,000
Other: $379,000
Other: $349,000
- Long Term Debt - Beginning Outstanding - Unspecified Public Purpose: $87,619,000
Outstanding Unspecified Public Purpose: $57,850,000
Retired Unspecified Public Purpose: $29,769,000
Beginning Outstanding - Unspecified Public Purpose: $28,081,000
Retired Unspecified Public Purpose: $28,081,000
- Miscellaneous - General Revenue - Other: $2,166,000
General Revenue - Other: $1,741,000
Interest Earnings: $490,000
Interest Earnings: $394,000
Fines and Forfeits: $306,000
Fines and Forfeits: $246,000
Donations From Private Sources: $13,000
Donations From Private Sources: $10,000
Sale of Property: $7,000
Sale of Property: $4,000
- Other Capital Outlay - Elementary and Secondary Education: $2,284,000
Elementary and Secondary Education: $2,208,000
General - Other: $669,000
General - Other: $646,000
- Other Funds - Cash and Securities: $48,874,000
Cash and Securities: $41,755,000
- Sinking Funds - Cash and Securities: $1,330,000
Cash and Securities: $1,136,000
- State Intergovernmental - Education: $33,685,000
Education: $31,801,000
Other: $5,010,000
Other: $4,742,000
General Local Government Support: $3,493,000
General Local Government Support: $3,306,000
Public Welfare: $2,205,000
Public Welfare: $2,087,000
- Tax - Property: $45,524,000
Property: $42,134,000
Other Selective Sales: $7,252,000
Other Selective Sales: $6,712,000
Motor Vehicle License: $1,217,000
Motor Vehicle License: $1,127,000
Other License: $490,000
Other License: $453,000
- Total Salaries and Wages: $35,361,000
: $33,201,000
Supplemental Security Income (SSI) in 2006:
- Total number of recipients: 508
- Number of aged recipients: 56
- Number of blind and disabled recipients: 452
- Number of recipients under 18: 69
- Number of recipients between 18 and 64: 299
- Number of recipients older than 64: 140
- Number of recipients also receiving OASDI: 233
- Amount of payments (thousands of dollars): 197
| Most common first names in Orange County, VA among deceased individuals | ||
| Name | Count | Lived (average) |
|---|---|---|
| William | 182 | 72.3 years |
| James | 160 | 70.9 years |
| Mary | 147 | 79.6 years |
| John | 127 | 75.4 years |
| Robert | 123 | 71.1 years |
| George | 92 | 74.7 years |
| Charles | 78 | 71.6 years |
| Thomas | 58 | 71.6 years |
| Joseph | 54 | 73.6 years |
| Henry | 52 | 76.9 years |
| Most common last names in Orange County, VA among deceased individuals | ||
| Last name | Count | Lived (average) |
|---|---|---|
| Smith | 96 | 75.2 years |
| Johnson | 80 | 75.3 years |
| Morris | 58 | 75.7 years |
| Williams | 49 | 78.3 years |
| Brown | 48 | 75.6 years |
| Miller | 45 | 75.5 years |
| Carter | 37 | 72.0 years |
| Jones | 36 | 74.6 years |
| Davis | 36 | 76.2 years |
| Ellis | 34 | 71.4 years |
| Businesses in Orange County, VA | ||||
| Name | Count | Name | Count | |
|---|---|---|---|---|
| 7-Eleven | 3 | La-Z-Boy | 1 | |
| AT&T | 2 | Lane Furniture | 1 | |
| Advance Auto Parts | 2 | Long John Silver's | 1 | |
| Best Western | 1 | Lowe's | 1 | |
| Burger King | 3 | MasterBrand Cabinets | 8 | |
| CVS | 2 | McDonald's | 3 | |
| Chevrolet | 1 | Nike | 1 | |
| Domino's Pizza | 1 | Pizza Hut | 1 | |
| Dunkin Donuts | 1 | Subaru | 1 | |
| FedEx | 6 | Subway | 4 | |
| H&R Block | 1 | True Value | 2 | |
| Hardee's | 2 | U-Haul | 1 | |
| Holiday Inn | 1 | UPS | 3 | |
| IHOP | 1 | Walmart | 1 | |
| KFC | 1 | |||
Orange County on our top lists:
- #71 on the list of "Top 101 counties with the lowest ground withdrawal of fresh water for public supply"