Crime rate in Abilene, Texas (TX): murders, rapes, robberies, assaults, burglaries, thefts, auto thefts, arson, law enforcement employees, police officers, crime map
Crime rate in Abilene, TX
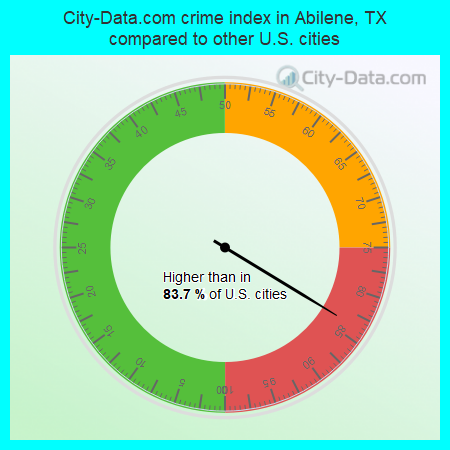
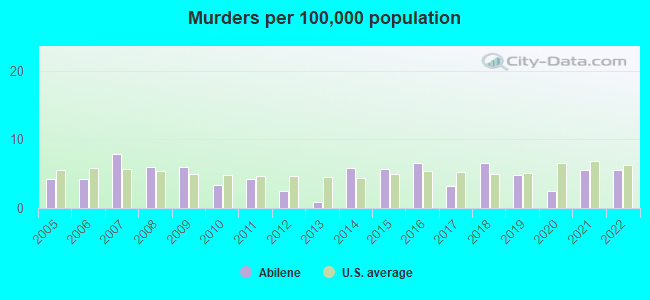
The 2022 crime rate in Abilene, TX is 259 (City-Data.com crime index), which is comparable to the U.S. average. It was higher than in 83.6% U.S. cities. The 2022 Abilene crime rate fell by 7% compared to 2021. The number of homicides stood at 7. In the last 5 years Abilene has seen decline of violent crime and decreasing property crime.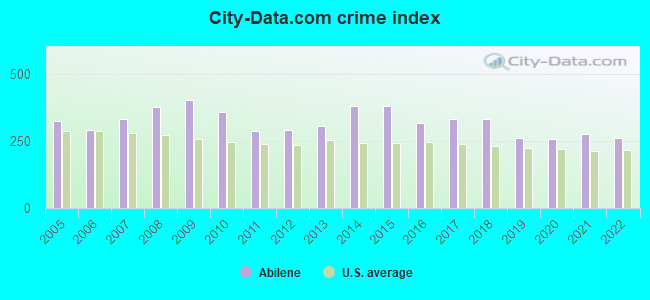
The City-Data.com crime index weighs serious crimes and violent crimes more heavily. Higher means more crime, U.S. average is 246.1. It adjusts for the number of visitors and daily workers commuting into cities.
- means the value is smaller than the state average.- means the value is about the same as the state average.
- means the value is bigger than the state average.
- means the value is much bigger than the state average.
According to our research of Texas and other state lists, there were 469 registered sex offenders living in Abilene, Texas as of May 23, 2024.
The ratio of all residents to sex offenders in Abilene is 274 to 1.
Violent crime rate in 2022
| Abilene: | 285.6 |
| U.S. Average: | 219.8 |
Violent crime rate in 2021
| Abilene: | 304.2 |
| U.S. Average: | 224.8 |
Violent crime rate in 2020
| Abilene: | 266.8 |
| U.S. Average: | 228.2 |
Violent crime rate in 2019
| Abilene: | 239.4 |
| U.S. Average: | 219.9 |
Violent crime rate in 2018
| Abilene: | 322.5 |
| U.S. Average: | 221.2 |
Violent crime rate in 2017
| Abilene: | 311.0 |
| U.S. Average: | 226.2 |
Violent crime rate in 2016
| Abilene: | 261.2 |
| U.S. Average: | 227.3 |
Violent crime rate in 2015
| Abilene: | 294.8 |
| U.S. Average: | 219.3 |
Violent crime rate in 2014
| Abilene: | 283.8 |
| U.S. Average: | 211.1 |
Violent crime rate in 2013
| Abilene: | 216.5 |
| U.S. Average: | 214.2 |
Violent crime rate in 2012
| Abilene: | 216.5 |
| U.S. Average: | 187.4 |
Violent crime rate in 2011
| Abilene: | 199.1 |
| U.S. Average: | 187.1 |
Violent crime rate in 2010
| Abilene: | 281.0 |
| U.S. Average: | 195.7 |
Violent crime rate in 2009
| Abilene: | 340.2 |
| U.S. Average: | 208.9 |
Violent crime rate in 2008
| Abilene: | 325.5 |
| U.S. Average: | 222.5 |
Violent crime rate in 2007
| Abilene: | 275.5 |
| U.S. Average: | 229.1 |
Violent crime rate in 2006
| Abilene: | 219.1 |
| U.S. Average: | 232.6 |
Violent crime rate in 2005
| Abilene: | 233.0 |
| U.S. Average: | 227.0 |
Property crime rate in 2022
| Abilene: | 169.0 |
| U.S. Average: | 166.5 |
Property crime rate in 2021
| Abilene: | 174.3 |
| U.S. Average: | 157.8 |
Property crime rate in 2020
| Abilene: | 175.7 |
| U.S. Average: | 169.6 |
Property crime rate in 2019
| Abilene: | 211.7 |
| U.S. Average: | 179.7 |
Property crime rate in 2018
| Abilene: | 252.7 |
| U.S. Average: | 190.2 |
Property crime rate in 2017
| Abilene: | 288.3 |
| U.S. Average: | 206.4 |
Property crime rate in 2016
| Abilene: | 305.5 |
| U.S. Average: | 216.6 |
Property crime rate in 2015
| Abilene: | 395.6 |
| U.S. Average: | 221.5 |
Property crime rate in 2014
| Abilene: | 387.5 |
| U.S. Average: | 230.8 |
Property crime rate in 2013
| Abilene: | 353.5 |
| U.S. Average: | 250.4 |
Property crime rate in 2012
| Abilene: | 327.2 |
| U.S. Average: | 267.3 |
Property crime rate in 2011
| Abilene: | 338.2 |
| U.S. Average: | 273.5 |
Property crime rate in 2010
| Abilene: | 396.4 |
| U.S. Average: | 276.4 |
Property crime rate in 2009
| Abilene: | 397.1 |
| U.S. Average: | 285.6 |
Property crime rate in 2008
| Abilene: | 369.2 |
| U.S. Average: | 302.2 |
Property crime rate in 2007
| Abilene: | 335.7 |
| U.S. Average: | 309.2 |
Property crime rate in 2006
| Abilene: | 327.1 |
| U.S. Average: | 317.3 |
Property crime rate in 2005
| Abilene: | 371.4 |
| U.S. Average: | 322.3 |


Full-time law enforcement employees in 2021, including police officers: 285 (210 officers - 193 male; 17 female).
| Officers per 1,000 residents here: | 1.68 |
| Texas average: | 2.07 |
Full-time law enforcement employees in 2020, including police officers: 275 (211 officers - 193 male; 18 female).
| Officers per 1,000 residents here: | 1.70 |
| Texas average: | 2.05 |
Full-time law enforcement employees in 2019, including police officers: 274 (213 officers - 197 male; 16 female).
| Officers per 1,000 residents here: | 1.72 |
| Texas average: | 2.02 |
Full-time law enforcement employees in 2018, including police officers: 268 (202 officers - 187 male; 15 female).
| Officers per 1,000 residents here: | 1.65 |
| Texas average: | 2.18 |
Full-time law enforcement employees in 2017, including police officers: 260 (200 officers - 185 male; 15 female).
| Officers per 1,000 residents here: | 1.63 |
| Texas average: | 2.06 |
Full-time law enforcement employees in 2015, including police officers: 277 (212 officers - 196 male; 16 female).
| Officers per 1,000 residents here: | 1.74 |
| Texas average: | 2.13 |
Full-time law enforcement employees in 2013, including police officers: 238 (170 officers - 159 male; 11 female).
| Officers per 1,000 residents here: | 1.42 |
| Texas average: | 2.05 |
Full-time law enforcement employees in 2011, including police officers: 241 (181 officers - 169 male; 12 female).
| Officers per 1,000 residents here: | 1.51 |
| Texas average: | 2.17 |
Full-time law enforcement employees in 2010, including police officers: 250 (183 officers - 170 male; 13 female).
| Officers per 1,000 residents here: | 1.56 |
| Texas average: | 2.20 |
Full-time law enforcement employees in 2009, including police officers: 256 (181 officers - 170 male; 11 female).
| Officers per 1,000 residents here: | 1.55 |
| Texas average: | 2.23 |
Full-time law enforcement employees in 2008, including police officers: 242 (178 officers - 169 male; 9 female).
| Officers per 1,000 residents here: | 1.53 |
| Texas average: | 2.17 |
Full-time law enforcement employees in 2007, including police officers: 232 (163 officers - 154 male; 9 female).
| Officers per 1,000 residents here: | 1.42 |
| Texas average: | 2.18 |
Full-time law enforcement employees in 2006, including police officers: 249 (186 officers - 176 male; 10 female).
| Officers per 1,000 residents here: | 1.58 |
| Texas average: | 2.13 |
Full-time law enforcement employees in 2005, including police officers: 235 (177 officers - 168 male; 9 female).
| Officers per 1,000 residents here: | 1.52 |
| Texas average: | 2.18 |
Full-time law enforcement employees in 2004, including police officers: 229 (171 officers - 161 male; 10 female).
| Officers per 1,000 residents here: | 1.46 |
| Texas average: | 2.19 |
Full-time law enforcement employees in 2003, including police officers: 216 (162 officers - 156 male; 6 female).
| Officers per 1,000 residents here: | 1.38 |
| Texas average: | 2.17 |


Zip codes: 79563, 79601, 79602, 79603, 79605, 79606, 79607, 79699.