| Fire incidents reported |
|---|
| Sreet name | Count |
|---|
| SIERRA | 68 | | CROWN VALLEY | 62 | | SOLEDAD CANYON | 52 | | NB 14 NO ESCONDIDO CANYON | 26 | | SB 14 SO RED ROVER MINE | 22 | | SB 14 NO ANGELES FOREST | 20 | | ANGELES FOREST | 18 | | CARSON MESA | 14 | | ESCONDIDO CANYON | 14 | | NB 14 SO PEARBLOSSOM | 12 | | NB 14 SO RED ROVER MINE | 12 | | RED ROVER MINE | 12 | | HUBBARD | 10 | | NB 14 AT RED ROVER MINE | 10 | | NB 14 NO PEARBLOSSOM | 10 | | SB 14 NO CROWN VALLEY | 10 | | SB 14 NO ESCONDIDO CANYON | 10 | | ARRASTRE CANYON | 8 | | CROWN VALLEY RD/14 | 8 | | DESERT | 8 | | NB 14 AT PEARBLOSSOM | 8 | | NB 14 SO ANGELES FOREST | 8 | | SANTIAGO | 8 | | SB 14 NO PEARBLOSSOM | 8 | | SB 14 NO RED ROVER MINE | 8 |
| | | Fire incidents reported |
|---|
| Sreet name | Count |
|---|
| SB 14 NO SOLEDAD CYN | 8 | | SB 14 SO CROWN VALLEY | 8 | | SHANNON VALLEY | 8 | | SIERRA HWY14 | 8 | | WISCONSIN | 8 | | EL SASTRE | 6 | | GILLESPIE | 6 | | MC ENNERY CANYON | 6 | | NB 14 NO ANGELES FOREST | 6 | | SANTIAGO RD/14 | 6 | | SB 14 NO SANTIAGO | 6 | | SOLEDAD PASS | 6 | | VIA FAMERO | 6 | | 47TH | 4 | | ALISO CANYON | 4 | | ARKSEY | 4 | | ASPEN | 4 | | BANDELL | 4 | | BOOTLEGGER CANYON | 4 | | BRAELOCH | 4 | | BUFFALO RIDGE | 4 | | CLANFIELD | 4 | | FWY | 4 | | HUGHES CANYON | 4 | | JUNIPER VALLEY | 4 |
|
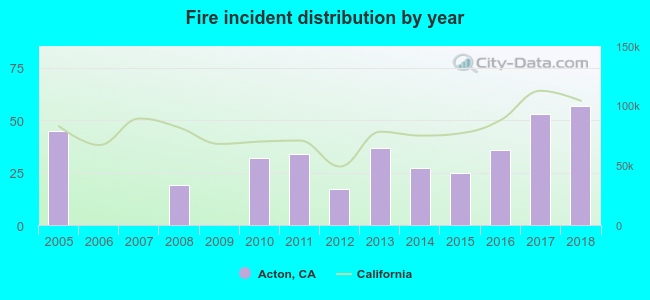 Based on the data from the years 2005 - 2018 the average number of fire incidents per year is 27. The highest number of reported fires - 57 took place in 2018, and the least - 0 in 2006. The data has a rising trend.
 34.6% incidents where reported in the morning and 65.4% in the evening. The most fires (18.6%) took place on Saturday, and the least (7.9%) on Wednesday.
 According to the 382 fires from years 2005 - 2018 most fires (12.6%) took place during July, and the least (6.0%) in December.
 Out of all 4,070 cases reported during the years 2005 - 2018, the most belonged to the categories: Rescue & EMS (57.4%), Good Intent Call (20.9%), and Fire (9.4%).
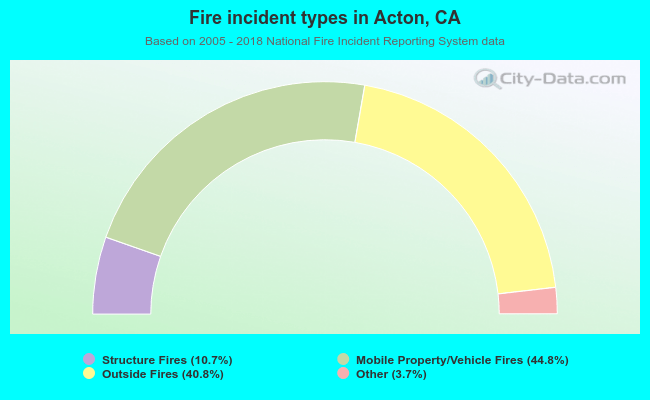 When looking into fire subcategories, the most incidents belonged to: Mobile Property/Vehicle Fires (44.8%), and Outside Fires (40.8%).