Appleton: Fire Incidents, Wisconsin (WI)
Where are fire incidents reported in Appleton, WI
Something went wrong! Please refresh the page.
| Fire incidents reported | |
|---|---|
| Sreet name | Count |
| COLLEGE AVE | 118 |
| CALUMET ST | 90 |
| ONEIDA ST | 80 |
| NORTHLAND AVE | 66 |
| RICHMOND ST | 58 |
| BALLARD RD | 56 |
| MEADE ST | 52 |
| WISCONSIN AVE | 50 |
| MASON ST | 44 |
| SECOND ST | 42 |
| LAWE ST | 38 |
| KENSINGTON DR | 36 |
| PROSPECT AVE | 36 |
| APPLETON ST | 28 |
| MEMORIAL DR | 28 |
| MORRISON ST | 28 |
| DIVISION ST | 26 |
| NEWBERRY ST | 26 |
| PACKARD ST | 26 |
| HY 41 NB | 24 |
| SCHINDLER PL | 24 |
| SPENCER ST | 24 |
| SUPERIOR ST | 24 |
| DOUGLAS ST | 22 |
| FRANKLIN ST | 22 |
| HERITAGE WOODS DR | 22 |
| KERNAN AVE | 22 |
| LAWRENCE ST | 22 |
| VAN ROY RD | 22 |
| BRIARCLIFF DR | 20 |
| Other | 648 |
2002 - 2018 National Fire Incident Reporting System (NFIRS) incidents
- Incident types reported to NFIRS in Appleton, WI
- 12,82452.8%Rescue & EMS
- 4,21217.3%Hazardous Condition
- 2,46110.1%False Alarm
- 1,8247.5%Fire
- 1,4325.9%Service Call
- 1,2775.3%Good Intent Call
- 2250.9%Overpressure Rupture
- Fire incident types reported to NFIRS in Appleton, WI
- 1,03556.7%Structure Fires
- 44924.6%Outside Fires
- 30016.4%Mobile Property/Vehicle Fires
- 402.2%Other
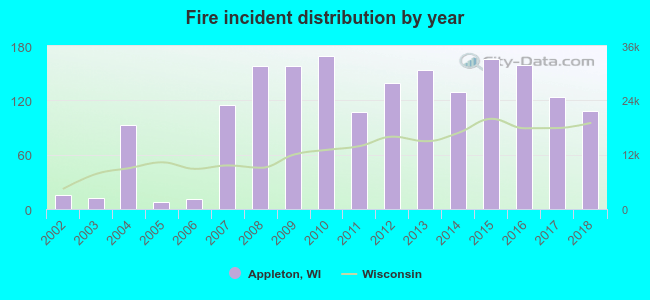 Based on the data from the years 2002 - 2018 the average number of fire incidents per year is 107. The highest number of reported fire incidents - 169 took place in 2010, and the least - 8 in 2005. The data has a growing trend.
The average number of yearly fire incidents per 10k residents in Appleton, WI compared to nearest cities:
(Note: Based on data for the last 3 years, including only cities with population 5,000 and above)
| Appleton: | 17.6 |
| Grand Chute: | 32.3 |
| Kimberly: | 14.9 |
| Menasha: | 31.6 |
| Little Chute: | 11.4 |
| Buchanan: | 1.5 |
| Harrison: | 9.8 |
| Kaukauna: | 24.9 |
| Neenah: | 32.4 |
 The median response time based on all reported fire incidents is 5 minutes. This is lower than the state median value.
The median response time in Appleton, WI compared to nearest cities:
(Note: Based on data for all years, including only cities with at least 500 fire incidents)
| Appleton: | 5 minutes |
| Grand Chute: | 5 minutes |
| Menasha: | 5 minutes |
| Kaukauna: | 6 minutes |
| Neenah: | 5 minutes |
| Oshkosh: | 5 minutes |
| De Pere: | 6 minutes |
| Green Bay: | 5 minutes |
 According to the data from the years 2002 - 2018 the average number of fire-related casualties per year is 3. The highest number of reported injuries - 8 took place in 2016, and the lowest - 0 in 2002. The data has a rising trend.
The average number of injuries per 1,000 fires is 28. This indicator was the highest - 167 in 2003, and the lowest 0 in 2002. The trend for casualties per 1,000 fire incidents is rising. Compared to the Wisconsin value the number of casualties per 1,000 fire incidents is much higher.
According to the data from the years 2002 - 2018 the average number of fire-related casualties per year is 3. The highest number of reported injuries - 8 took place in 2016, and the lowest - 0 in 2002. The data has a rising trend.
The average number of injuries per 1,000 fires is 28. This indicator was the highest - 167 in 2003, and the lowest 0 in 2002. The trend for casualties per 1,000 fire incidents is rising. Compared to the Wisconsin value the number of casualties per 1,000 fire incidents is much higher.
 33.9% incidents where reported in the morning and 66.1% in the evening. The most fires (18.0%) took place on Saturday, and the least (11.8%) on Wednesday.
 According to the 1,824 fire incidents from years 2002 - 2018 most fires (10.6%) took place during July, and the least (4.6%) in February.
 Out of all 24,292 cases reported during the years 2002 - 2018, the most belonged to the categories: Rescue & EMS (52.8%), Hazardous Condition (17.3%), and False Alarm (10.1%).
 When looking into fire subcategories, the most incidents belonged to: Structure Fires (56.7%), and Outside Fires (24.6%).