Ardmore: Fire Incidents, Oklahoma (OK)
Where are fire incidents reported in Ardmore, OK
Something went wrong! Please refresh the page.
| Fire incidents reported | |
|---|---|
| Sreet name | Count |
| BROADWAY | 94 |
| COMMERCE | 92 |
| S COMMERCE | 92 |
| N COMMERCE | 86 |
| 12TH AVE NW | 82 |
| VETERANS BLVD | 70 |
| W BROADWAY | 68 |
| 3RD AVE NE | 64 |
| MARY NIBLACK RD | 58 |
| HOLIDAY DR | 56 |
| I-35 | 52 |
| D ST SE | 46 |
| I35 | 46 |
| SPRINGDALE RD | 46 |
| CARTER | 42 |
| SAM NOBLE PKWY | 42 |
| 4TH AVE NW | 38 |
| C ST NW | 38 |
| COOPER DR | 38 |
| MYALL ST | 38 |
| C ST SE | 36 |
| MT WASHINGTON RD | 36 |
| N WASHINGTON | 36 |
| 4TH AVE NE | 34 |
| 7TH AVE NW | 34 |
| A ST NW | 34 |
| F ST NE | 32 |
| L ST NE | 32 |
| LAKE MURRAY DR | 32 |
| MAIN | 32 |
| Other | 1,169 |
2002 - 2018 National Fire Incident Reporting System (NFIRS) incidents
- Incident types reported to NFIRS in Ardmore, OK
- 6,97947.8%Rescue & EMS
- 2,69518.4%Fire
- 1,92713.2%Good Intent Call
- 1,79112.3%Hazardous Condition
- 7485.1%False Alarm
- 4343.0%Service Call
- 230.2%Overpressure Rupture
- Fire incident types reported to NFIRS in Ardmore, OK
- 1,41752.6%Outside Fires
- 78429.1%Structure Fires
- 41915.5%Mobile Property/Vehicle Fires
- 752.8%Other
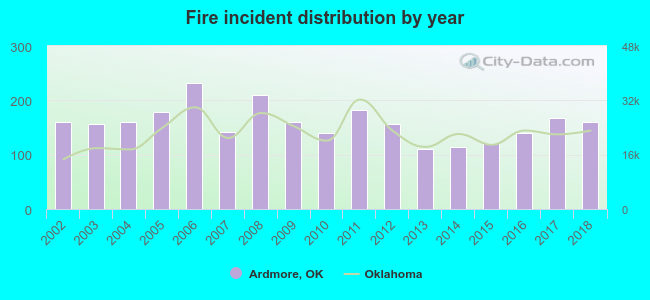 According to the data from the years 2002 - 2018 the average number of fires per year is 159. The highest number of fire incidents - 231 took place in 2006, and the least - 111 in 2013. The data has a dropping trend.
The average number of yearly fire incidents per 10k residents in Ardmore, OK compared to nearest cities:
(Note: Based on data for the last 3 years, including only cities with population 5,000 and above)
| Ardmore: | 61.8 |
| Lone Grove: | 34.5 |
| Sulphur: | 169.6 |
| Pauls Valley: | 165.8 |
| Durant: | 91.3 |
 The median response time based on all reported fire incidents is 5 minutes. This is lower compared to the state median value.
The median response time in Ardmore, OK compared to nearest cities:
(Note: Based on data for all years, including only cities with at least 500 fire incidents)
| Ardmore: | 5 minutes |
| Wilson: | 9 minutes |
| Marietta: | 10 minutes |
| Davis: | 10 minutes |
| Sulphur: | 6 minutes |
| Tishomingo: | 5 minutes |
| Kingston: | 8 minutes |
| Thackerville: | 10 minutes |
| Velma: | 10 minutes |
 According to the data from the years 2002 - 2018 the average number of fire-related fatalities per year is 0. The highest number of deaths - 3 took place in 2003, and the lowest - 0 in 2002. The data has a constant trend.
The average number of fatalities per 1,000 fires is 3. This indicator was the highest - 19 in 2003, and the lowest 0 in 2002. The trend for deaths per 1,000 incidents is constant. Compared to the state value the number of fatalities per 1,000 fire incidents is higher.
According to the data from the years 2002 - 2018 the average number of fire-related fatalities per year is 0. The highest number of deaths - 3 took place in 2003, and the lowest - 0 in 2002. The data has a constant trend.
The average number of fatalities per 1,000 fires is 3. This indicator was the highest - 19 in 2003, and the lowest 0 in 2002. The trend for deaths per 1,000 incidents is constant. Compared to the state value the number of fatalities per 1,000 fire incidents is higher.Deaths per 1,000 incidents in Ardmore, OK compared to nearest cities:
(Note: Based on data for all years, including only cities with at least 2,500 fire incidents)
| Ardmore: | 3.0 |
| Durant: | 1.1 |
 According to the data from the years 2002 - 2018 the average number of fire-related yearly casualties is 1. The highest number of injuries - 3 took place in 2004, and the lowest - 0 in 2007. The data has a dropping trend.
The average number of injuries per 1,000 fire incidents is 6. This indicator was the highest - 19 in 2004, and the lowest 0 in 2007. The trend for casualties per 1,000 fires is declining. Compared to the state value the number of injuries per 1,000 incidents is higher.
According to the data from the years 2002 - 2018 the average number of fire-related yearly casualties is 1. The highest number of injuries - 3 took place in 2004, and the lowest - 0 in 2007. The data has a dropping trend.
The average number of injuries per 1,000 fire incidents is 6. This indicator was the highest - 19 in 2004, and the lowest 0 in 2007. The trend for casualties per 1,000 fires is declining. Compared to the state value the number of injuries per 1,000 incidents is higher.Casualties per 1,000 incidents in Ardmore, OK compared to nearest cities:
(Note: Based on data for all years, including only cities with at least 500 fire incidents)
| Ardmore: | 5.9 |
| Wilson: | 0.0 |
| Marietta: | 1.4 |
| Davis: | 1.4 |
| Sulphur: | 1.4 |
| Tishomingo: | 0.0 |
| Kingston: | 2.9 |
| Thackerville: | 0.0 |
| Velma: | 1.7 |
 29.0% incidents where reported in the morning and 71.0% in the evening. The most fires (15.4%) took place on Saturday, and the least (12.8%) on Sunday.
 According to the 2,695 fire incident reports from years 2002 - 2018 most fires (11.5%) took place during July, and the least (6.1%) in May.
 Out of all 14,610 cases reported during the years 2002 - 2018, the most belonged to the categories: Rescue & EMS (47.8%), Fire (18.4%), and Good Intent Call (13.2%).
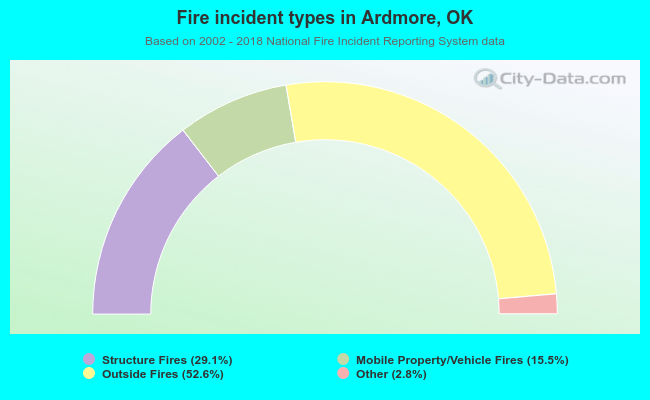 When looking into fire subcategories, the most reports belonged to: Outside Fires (52.6%), and Structure Fires (29.1%).