Ashland: Fire Incidents, Virginia (VA)
Where are fire incidents reported in Ashland, VA
Something went wrong! Please refresh the page.
| Fire incidents reported | |
|---|---|
| Sreet name | Count |
| INTERSTATE 95 | 474 |
| WASHINGTON HWY | 278 |
| ENGLAND ST | 178 |
| WASHINGTON HW | 172 |
| ASHCAKE RD | 148 |
| I-95 | 132 |
| I95 | 106 |
| LEWISTOWN RD | 90 |
| PATRICK HENRY RD | 90 |
| CARTER RD | 76 |
| AIR PARK RD | 70 |
| ASHLAND RD | 62 |
| MOUNT HERMON RD | 62 |
| CEDAR LN | 58 |
| SLIDING HILL RD | 58 |
| WASHINGTON | 58 |
| ELMONT RD | 56 |
| THOMPSON ST | 46 |
| SADISCO DR | 42 |
| GREENWOOD CHURCH RD | 40 |
| HENRY CLAY RD | 40 |
| ARLINGTON ST | 38 |
| JAMES ST | 38 |
| MOUNTAIN RD | 38 |
| HENRY ST | 34 |
| LEADBETTER RD | 34 |
| GREENWOOD RD | 32 |
| KINGS CHARTER DR | 32 |
| CENTER ST | 30 |
| CENTRAL DR | 30 |
2002 - 2018 National Fire Incident Reporting System (NFIRS) incidents
- Incident types reported to NFIRS in Ashland, VA
- 6,35236.8%Rescue & EMS
- 4,10923.8%Good Intent Call
- 2,47114.3%Fire
- 2,31413.4%Hazardous Condition
- 1,0095.8%False Alarm
- 9275.4%Service Call
- 450.3%Special Incident
- 290.2%Overpressure Rupture
- Fire incident types reported to NFIRS in Ashland, VA
- 98940.0%Structure Fires
- 75230.4%Outside Fires
- 58323.6%Mobile Property/Vehicle Fires
- 1475.9%Other
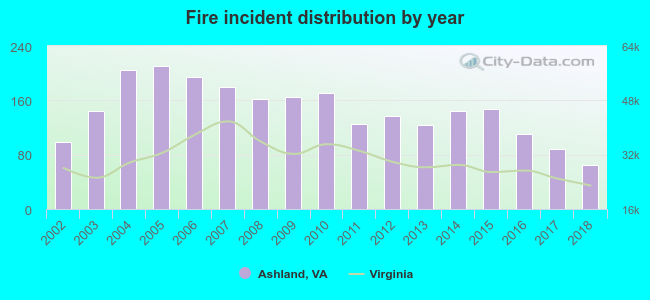 Based on the data from the years 2002 - 2018 the average number of fires per year is 145. The highest number of fires - 210 took place in 2005, and the least - 65 in 2018. The data has a decreasing trend.
The average number of yearly fire incidents per 10k residents in Ashland, VA compared to nearest cities:
(Note: Based on data for the last 3 years, including only cities with population 5,000 and above)
| Ashland: | 120.5 |
| Glen Allen: | 76.3 |
| Mechanicsville: | 60.6 |
| Richmond: | 66.9 |
| Highland Springs: | 22.3 |
| Bon Air: | 18.3 |
| Sandston: | 66.5 |
| Bensley: | 56.7 |
| Bellwood: | 45.7 |
 The median response time based on all reported fire incidents is 8 minutes. This is about the same as the Virginia median value.
The median response time in Ashland, VA compared to nearest cities:
(Note: Based on data for all years, including only cities with at least 500 fire incidents)
| Ashland: | 8 minutes |
| Glen Allen: | 6 minutes |
| Mechanicsville: | 8 minutes |
| Richmond: | 5 minutes |
| Highland Springs: | 5 minutes |
| Sandston: | 6 minutes |
| Goochland: | 13 minutes |
| Chester: | 6 minutes |
| Mineral: | 12 minutes |
 According to the data from the years 2002 - 2018 the average number of fire-related yearly casualties is 1. The highest number of reported casualties - 8 took place in 2004, and the lowest - 0 in 2005. The data has a declining trend.
The average number of casualties per 1,000 fire incidents is 6. This indicator was the highest - 39 in 2004, and the lowest 0 in 2005. The trend for casualties per 1,000 fires is dropping. Compared to the state value the number of casualties per 1,000 fire incidents is much lower.
According to the data from the years 2002 - 2018 the average number of fire-related yearly casualties is 1. The highest number of reported casualties - 8 took place in 2004, and the lowest - 0 in 2005. The data has a declining trend.
The average number of casualties per 1,000 fire incidents is 6. This indicator was the highest - 39 in 2004, and the lowest 0 in 2005. The trend for casualties per 1,000 fires is dropping. Compared to the state value the number of casualties per 1,000 fire incidents is much lower.Casualties per 1,000 incidents in Ashland, VA compared to nearest cities:
(Note: Based on data for all years, including only cities with at least 500 fire incidents)
| Ashland: | 6.1 |
| Glen Allen: | 24.1 |
| Mechanicsville: | 4.6 |
| Richmond: | 26.0 |
| Highland Springs: | 44.5 |
| Sandston: | 18.9 |
| Goochland: | 4.3 |
| Chester: | 40.8 |
| Mineral: | 1.8 |
 34.5% incidents where reported in the morning and 65.5% in the evening. The most fires (15.7%) took place on Wednesday, and the least (12.7%) on Friday.
 Based on the 2,471 fire incident reports from years 2002 - 2018 most fires (9.9%) took place during August, and the least (6.8%) in May.
 Out of all 17,268 cases reported during the years 2002 - 2018, the most belonged to the categories: Rescue & EMS (36.8%), Good Intent Call (23.8%), and Fire (14.3%).
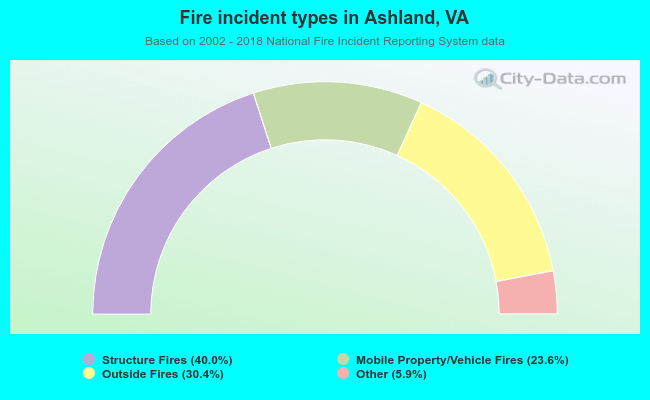 When looking into fire subcategories, the most reports belonged to: Structure Fires (40.0%), and Outside Fires (30.4%).