Astoria: Fire Incidents, Oregon (OR)
Where are fire incidents reported in Astoria, OR
Something went wrong! Please refresh the page.
| Fire incidents reported | |
|---|---|
| Sreet name | Count |
| MARINE DR | 192 |
| EXCHANGE ST | 72 |
| UNREPORTED | 70 |
| COMMERCIAL ST | 62 |
| DUANE ST | 46 |
| LEIF ERICKSON DR | 44 |
| ALAMEDA AVE | 42 |
| BOND ST | 42 |
| 10TH ST | 28 |
| 11TH ST | 28 |
| 7TH ST | 28 |
| FRANKLIN ST | 28 |
| HALSEY RD | 28 |
| IRVING AVE | 28 |
| 6TH ST | 26 |
| 12TH ST | 24 |
| 16TH ST | 24 |
| KLASKANINE AVE | 24 |
| 14TH ST | 22 |
| LEWIS AND CLARK RD | 22 |
| 8TH ST | 20 |
| HIGHWAY 105 | 20 |
| KENSINGTON AVE | 20 |
| YOUNGS RIVER RD | 20 |
| 202 HWY | 18 |
| 30TH ST | 18 |
| LOGAN RD | 18 |
| NIAGARA AVE | 18 |
| 34TH ST | 16 |
| DOW LN | 16 |
| Other | 177 |
2002 - 2018 National Fire Incident Reporting System (NFIRS) incidents
- Incident types reported to NFIRS in Astoria, OR
- 2,93648.4%Rescue & EMS
- 1,24120.5%Fire
- 68011.2%Good Intent Call
- 5068.3%Hazardous Condition
- 3375.6%Service Call
- 3125.1%False Alarm
- 430.7%Severe Weather
- Fire incident types reported to NFIRS in Astoria, OR
- 60648.8%Structure Fires
- 41233.2%Outside Fires
- 13110.6%Mobile Property/Vehicle Fires
- 927.4%Other
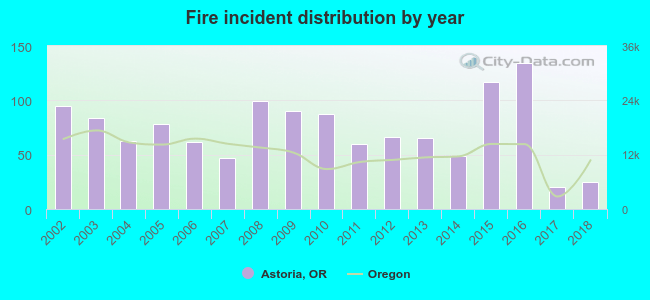 According to the data from the years 2002 - 2018 the average number of fires per year is 73. The highest number of reported fires - 134 took place in 2016, and the least - 20 in 2017. The data has a declining trend.
 The median response time based on all reported fire incidents is 6 minutes. This is close to the state median value.
 Based on the data from the years 2002 - 2018 the average number of fire-related yearly casualties is 0. The highest number of injuries - 2 took place in 2016, and the lowest - 0 in 2002. The data has a constant trend.
The average number of casualties per 1,000 fires is 4. This indicator was the highest - 20 in 2014, and the lowest 0 in 2002. The trend for casualties per 1,000 incidents is constant. Compared to the state value the number of injuries per 1,000 fires is much lower.
Based on the data from the years 2002 - 2018 the average number of fire-related yearly casualties is 0. The highest number of injuries - 2 took place in 2016, and the lowest - 0 in 2002. The data has a constant trend.
The average number of casualties per 1,000 fires is 4. This indicator was the highest - 20 in 2014, and the lowest 0 in 2002. The trend for casualties per 1,000 incidents is constant. Compared to the state value the number of injuries per 1,000 fires is much lower.
 31.8% incidents where reported in the morning and 68.2% in the evening. The most fires (17.1%) took place on Friday, and the least (12.3%) on Sunday.
 According to the 1,241 fire incident reports from years 2002 - 2018 most fires (14.7%) took place during July, and the least (5.7%) in April.
 Out of all 6,063 cases reported during the years 2002 - 2018, the most belonged to the categories: Rescue & EMS (48.4%), Fire (20.5%), and Good Intent Call (11.2%).
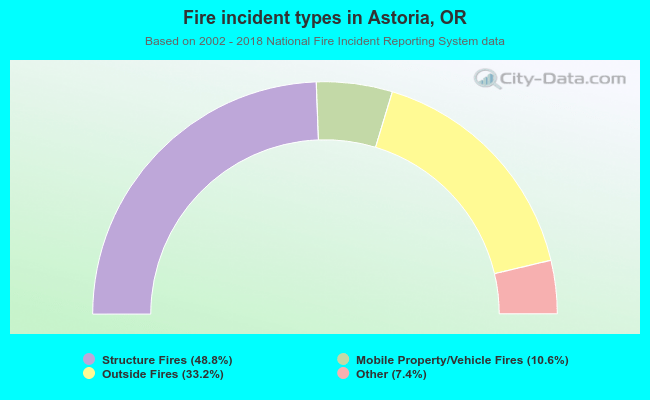 When looking into fire subcategories, the most incidents belonged to: Structure Fires (48.8%), and Outside Fires (33.2%).