Bear: Fire Incidents, Delaware (DE)
Where are fire incidents reported in Bear, DE
Something went wrong! Please refresh the page.
| Fire incidents reported | |
|---|---|
| Sreet name | Count |
| PULASKI HWY | 230 |
| RED LION RD | 126 |
| PORTER RD | 86 |
| FOXHUNT DR | 56 |
| WRANGLE HILL RD | 52 |
| BEAR CHRISTIANA RD | 50 |
| WOODCHUCK PL | 50 |
| SQUIRREL DR | 46 |
| HOWELL SCHOOL RD | 42 |
| GOVERNORS PL | 36 |
| BRANDYWINE DR | 34 |
| EDEN CIR | 32 |
| ANTLERS PL | 30 |
| PORTSIDE CT | 28 |
| KING JAMES CT | 26 |
| CHURCH RD | 24 |
| OLD KIRKWOOD RD | 24 |
| CARLOTTA DR | 22 |
| CORNWELL DR | 22 |
| GOVERNOR LEA RD | 22 |
| OLD PORTER RD | 22 |
| VALERIE LN | 22 |
| BUCKLEY BLVD | 20 |
| CARAVEL DR | 20 |
| CINDY DR | 20 |
| GARWOOD DR | 20 |
| GREGORY DR | 20 |
| INGRAM ST | 20 |
| OXFORD DR | 20 |
| ROUTE 1 | 20 |
| Other | 1,432 |
2002 - 2018 National Fire Incident Reporting System (NFIRS) incidents
- Incident types reported to NFIRS in Bear, DE
- 2,67429.6%Fire
- 2,08223.1%Rescue & EMS
- 1,72919.2%Good Intent Call
- 1,31314.6%Hazardous Condition
- 8759.7%False Alarm
- 3173.5%Service Call
- 180.2%Overpressure Rupture
- 120.1%Severe Weather
- Fire incident types reported to NFIRS in Bear, DE
- 1,63761.2%Structure Fires
- 69726.1%Outside Fires
- 2599.7%Mobile Property/Vehicle Fires
- 813.0%Other
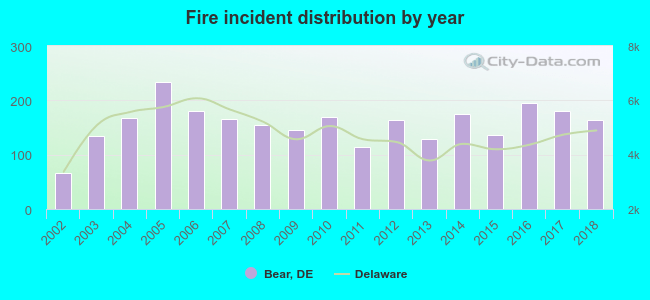 Based on the data from the years 2002 - 2018 the average number of fires per year is 157. The highest number of fire incidents - 233 took place in 2005, and the least - 67 in 2002. The data has an increasing trend.
The average number of yearly fire incidents per 10k residents in Bear, DE compared to nearest cities:
(Note: Based on data for the last 3 years, including only cities with population 5,000 and above)
| Bear: | 92.9 |
| Glasgow: | 1.4 |
| Newark: | 202.9 |
| Wilmington Manor: | 3.8 |
| New Castle: | 1,020.0 |
| Pike Creek: | 3.2 |
| Elsmere: | 19.0 |
| Hockessin: | 23.4 |
| Wilmington: | 159.3 |
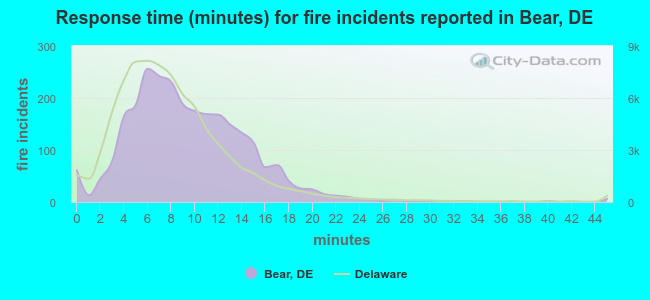 The median response time based on all reported fire incidents is 9 minutes. This is higher compared to the Delaware median value.
The median response time in Bear, DE compared to nearest cities:
(Note: Based on data for all years, including only cities with at least 500 fire incidents)
| Bear: | 9 minutes |
| Newark: | 8 minutes |
| Delaware City: | 8 minutes |
| New Castle: | 7 minutes |
| Hockessin: | 8 minutes |
| Wilmington: | 6 minutes |
| Middletown: | 8 minutes |
| Townsend: | 9 minutes |
| Claymont: | 6 minutes |
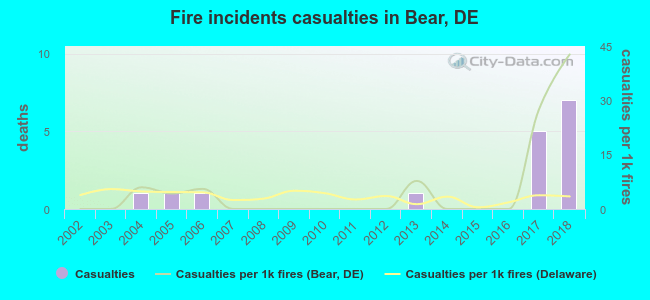 According to the reports from the years 2002 - 2018 the average number of fire-related yearly casualties is 1. The highest number of reported injuries - 7 took place in 2018, and the lowest - 0 in 2002. The data has a growing trend.
The average number of casualties per 1,000 fire incidents is 6. This indicator was the highest - 43 in 2018, and the lowest 0 in 2002. The trend for injuries per 1,000 fires is growing. Compared to the state value the number of injuries per 1,000 fires is higher.
According to the reports from the years 2002 - 2018 the average number of fire-related yearly casualties is 1. The highest number of reported injuries - 7 took place in 2018, and the lowest - 0 in 2002. The data has a growing trend.
The average number of casualties per 1,000 fire incidents is 6. This indicator was the highest - 43 in 2018, and the lowest 0 in 2002. The trend for injuries per 1,000 fires is growing. Compared to the state value the number of injuries per 1,000 fires is higher.Casualties per 1,000 incidents in Bear, DE compared to nearest cities:
(Note: Based on data for all years, including only cities with at least 500 fire incidents)
| Bear: | 6.0 |
| Newark: | 2.2 |
| Delaware City: | 6.2 |
| New Castle: | 3.4 |
| Hockessin: | 1.3 |
| Wilmington: | 4.5 |
| Middletown: | 3.8 |
| Townsend: | 4.1 |
| Claymont: | 6.4 |
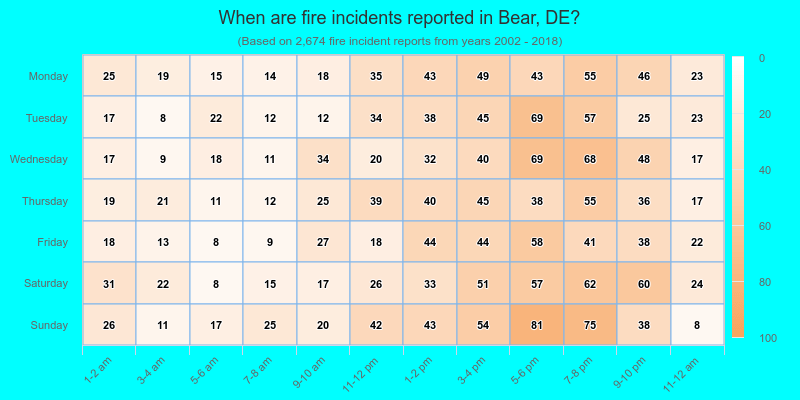
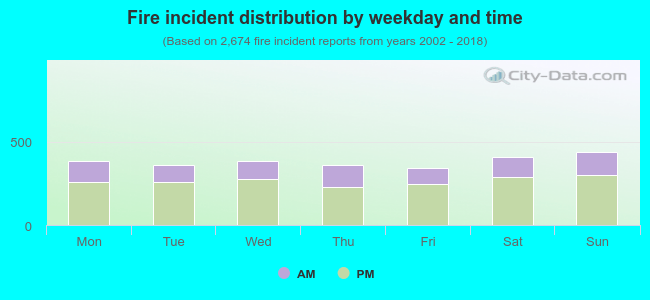 30.7% incidents where reported in the morning and 69.3% in the evening. The most fires (16.5%) took place on Sunday, and the least (12.7%) on Friday.
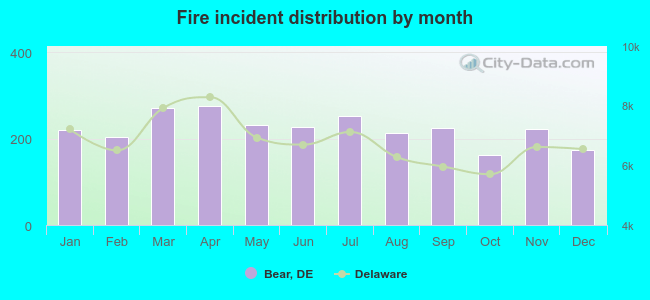 According to the 2,674 fires from years 2002 - 2018 most fires (10.3%) took place during April, and the least (6.0%) in October.
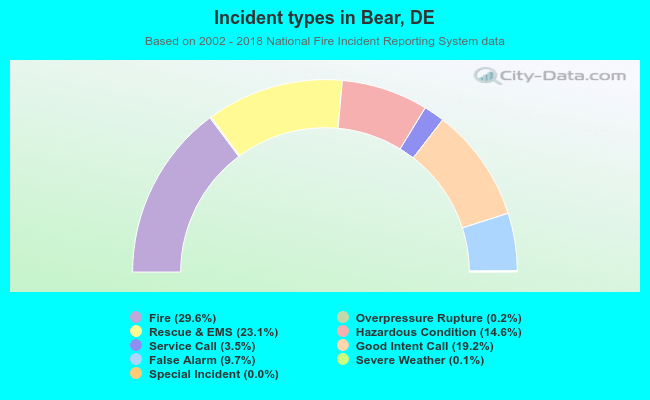 Out of all 9,024 cases reported during the years 2002 - 2018, the most belonged to the categories: Fire (29.6%), Rescue & EMS (23.1%), and Good Intent Call (19.2%).
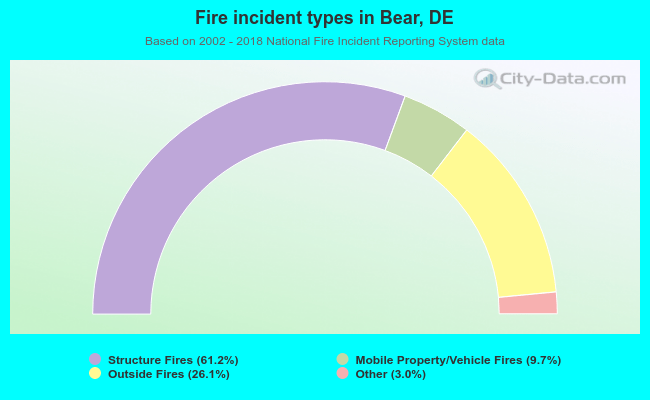 When looking into fire subcategories, the most incidents belonged to: Structure Fires (61.2%), and Outside Fires (26.1%).