Beech Island: Fire Incidents, South Carolina (SC)
Where are fire incidents reported in Beech Island, SC
Something went wrong! Please refresh the page.
|
| |||||||||||||||||||||||||||||||||||||||||||||||||||||||||||||||||||||||||||||||||||||||||||||||||||||||||||||
2002 - 2018 National Fire Incident Reporting System (NFIRS) incidents
- Incident types reported to NFIRS in Beech Island, SC
- 85438.0%Rescue & EMS
- 63428.2%Fire
- 45720.3%Good Intent Call
- 1114.9%Hazardous Condition
- 944.2%False Alarm
- 773.4%Service Call
- 130.6%Severe Weather
- 60.3%Special Incident
- Fire incident types reported to NFIRS in Beech Island, SC
- 31048.9%Structure Fires
- 24037.9%Outside Fires
- 7411.7%Mobile Property/Vehicle Fires
- 101.6%Other
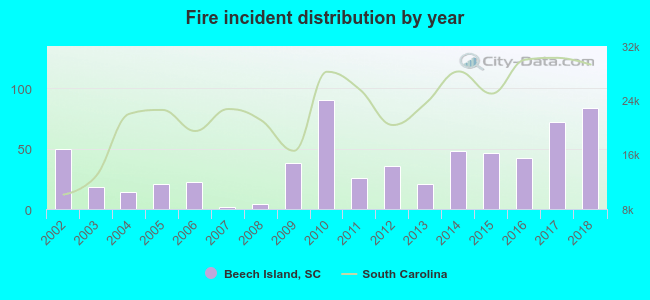 According to the data from the years 2002 - 2018 the average number of fires per year is 37. The highest number of fires - 90 took place in 2010, and the least - 2 in 2007. The data has a rising trend.
The average number of yearly fire incidents per 10k residents in Beech Island, SC compared to nearest cities:
(Note: Based on data for the last 3 years, including only cities with population 5,000 and above)
| Beech Island: | 77.9 |
| North Augusta: | 73.8 |
| Belvedere: | 90.9 |
| Aiken: | 82.3 |
 The median response time based on all reported fire incidents is 9 minutes. This is higher compared to the state median value.
The median response time in Beech Island, SC compared to nearest cities:
(Note: Based on data for all years, including only cities with at least 500 fire incidents)
| Beech Island: | 9 minutes |
| North Augusta: | 5 minutes |
| Belvedere: | 8 minutes |
| Augusta: | 5 minutes |
| Graniteville: | 9 minutes |
| Aiken: | 4 minutes |
| Martinez: | 5 minutes |
| Hephzibah: | 6 minutes |
| Evans: | 5 minutes |
 28.9% incidents where reported in the morning and 71.1% in the evening. The most fires (15.8%) took place on Friday, and the least (12.0%) on Monday.
 According to the 634 incident reports from years 2002 - 2018 most fires (11.4%) took place during January, and the least (5.2%) in September.
 Out of all 2,247 cases reported during the years 2002 - 2018, the most belonged to the categories: Rescue & EMS (38.0%), Fire (28.2%), and Good Intent Call (20.3%).
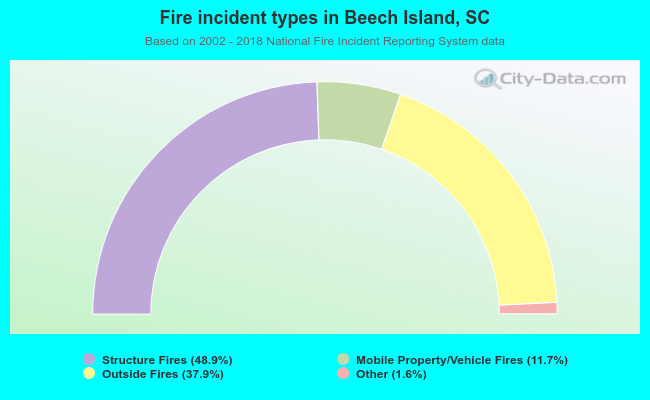 When looking into fire subcategories, the most incidents belonged to: Structure Fires (48.9%), and Outside Fires (37.9%).