Bennettsville: Fire Incidents, South Carolina (SC)
Where are fire incidents reported in Bennettsville, SC
Something went wrong! Please refresh the page.
| Fire incidents reported | |
|---|---|
| Sreet name | Count |
| 9 HWY | 142 |
| 38 HWY | 132 |
| SALEM RD | 120 |
| MAIN ST | 84 |
| STATE ST | 68 |
| 15-401 BYP | 66 |
| 15401 HWY | 66 |
| OAKWOOD ST | 62 |
| 385 HWY | 58 |
| WILLAMETTE RD | 58 |
| BEAUTY SPOT RD | 54 |
| MARSHALL ST | 54 |
| PARSONAGE ST | 54 |
| CHERAW ST | 50 |
| 15-401 HWY | 46 |
| 15401 BYP | 44 |
| ACADEMY RD | 44 |
| HAMLET HWY | 44 |
| 79 HWY | 42 |
| AARON TEMPLE CHURCH RD | 38 |
| BROAD ST | 36 |
| KING ST | 36 |
| WALLACE RD | 36 |
| COTTINGHAM BLVD | 34 |
| MARLBORO RD | 32 |
| AIRPORT RD | 30 |
| WESTWOOD CIR | 30 |
| BURNT FACTORY RD | 28 |
| JENNINGS ST | 28 |
| BREEDEN ST | 26 |
| Other | 651 |
2003 - 2018 National Fire Incident Reporting System (NFIRS) incidents
- Incident types reported to NFIRS in Bennettsville, SC
- 2,29351.3%Fire
- 73516.5%Rescue & EMS
- 51711.6%Hazardous Condition
- 4439.9%Good Intent Call
- 3247.3%False Alarm
- 1212.7%Service Call
- 200.4%Special Incident
- 110.2%Severe Weather
- Fire incident types reported to NFIRS in Bennettsville, SC
- 1,05546.0%Outside Fires
- 90039.2%Structure Fires
- 29612.9%Mobile Property/Vehicle Fires
- 421.8%Other
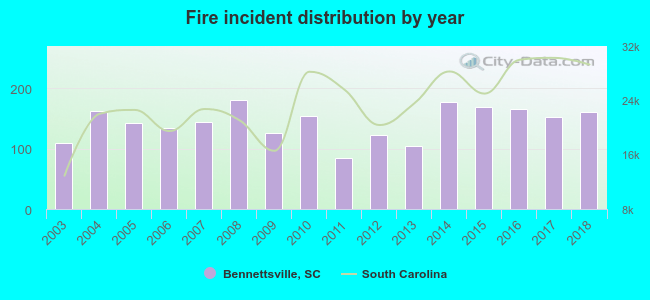 According to the data from the years 2003 - 2018 the average number of fires per year is 143. The highest number of fires - 180 took place in 2008, and the least - 85 in 2011. The data has a rising trend.
The average number of yearly fire incidents per 10k residents in Bennettsville, SC compared to nearest cities:
(Note: Based on data for the last 3 years, including only cities with population 5,000 and above)
| Bennettsville: | 181.1 |
| Cheraw: | 162.3 |
| Dillon: | 6.5 |
| Darlington: | 247.1 |
| Hamer: | 11.2 |
| Hartsville: | 310.7 |
| Florence: | 126.4 |
| Marion: | 88.9 |
 The median response time based on all reported fire incidents is 5 minutes. This is lower compared to the state median value.
The median response time in Bennettsville, SC compared to nearest cities:
(Note: Based on data for all years, including only cities with at least 500 fire incidents)
| Bennettsville: | 5 minutes |
| McColl: | 5 minutes |
| Cheraw: | 6 minutes |
| Laurinburg: | 5 minutes |
| Hamlet: | 7 minutes |
| Maxton: | 12 minutes |
| Rockingham: | 6 minutes |
| Rowland: | 12 minutes |
| Latta: | 8 minutes |
 According to the reports from the years 2003 - 2018 the average number of fire-related fatalities per year is 0. The highest number of reported deaths - 1 took place in 2007, and the lowest - 0 in 2003. The data has a constant trend.
 26.4% incidents where reported in the morning and 73.6% in the evening. The most fires (16.6%) took place on Saturday, and the least (11.3%) on Sunday.
 Based on the 2,293 reports from years 2003 - 2018 most fires (13.8%) took place during March, and the least (5.6%) in August.
 Out of all 4,468 cases reported during the years 2003 - 2018, the most belonged to the categories: Fire (51.3%), Rescue & EMS (16.5%), and Hazardous Condition (11.6%).
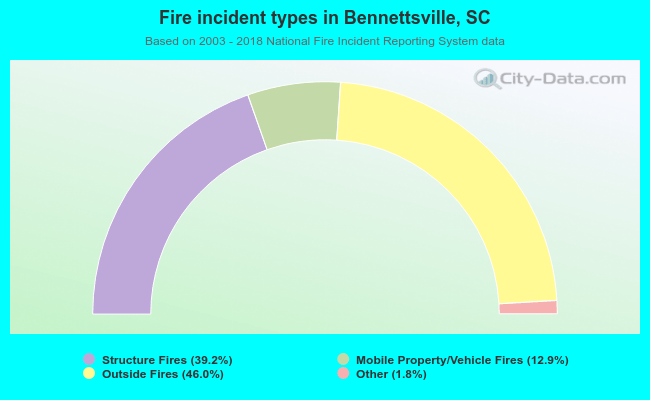 When looking into fire subcategories, the most incidents belonged to: Outside Fires (46.0%), and Structure Fires (39.2%).