Burlington: Fire Incidents, New Jersey (NJ)
Where are fire incidents reported in Burlington, NJ
Something went wrong! Please refresh the page.
|
| |||||||||||||||||||||||||||||||||||||||||||||||||||||||||||||||||||||||||||||||||||||||||||||||||||||||||||||
2002 - 2018 National Fire Incident Reporting System (NFIRS) incidents
- Incident types reported to NFIRS in Burlington, NJ
- 58740.6%Hazardous Condition
- 43229.9%Fire
- 18813.0%Good Intent Call
- 1429.8%Service Call
- 624.3%Rescue & EMS
- 342.4%False Alarm
- Fire incident types reported to NFIRS in Burlington, NJ
- 24356.3%Structure Fires
- 10825.0%Outside Fires
- 7316.9%Mobile Property/Vehicle Fires
- 81.9%Other
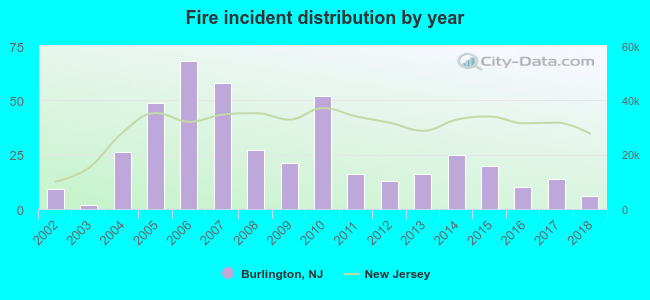 Based on the data from the years 2002 - 2018 the average number of fire incidents per year is 25. The highest number of reported fire incidents - 68 took place in 2006, and the least - 2 in 2003. The data has a dropping trend.
The average number of yearly fire incidents per 10k residents in Burlington, NJ compared to nearest cities:
(Note: Based on data for the last 3 years, including only cities with population 5,000 and above)
| Burlington: | 10.2 |
| Franklin Park: | 26.3 |
| Palmyra: | 35.0 |
| Trenton: | 67.6 |
| Yardville: | 1.4 |
| Marlton: | 8.6 |
| Pennsauken: | 43.1 |
| Ewing: | 70.3 |
| Haddonfield: | 26.9 |

 29.2% incidents where reported in the morning and 70.8% in the evening. The most fires (17.6%) took place on Sunday, and the least (13.2%) on Wednesday.
 Based on the 432 reports from years 2002 - 2018 most fires (13.4%) took place during January, and the least (5.1%) in October.
 Out of all 1,446 cases reported during the years 2002 - 2018, the most belonged to the categories: Rescue & EMS (40.6%), Fire (29.9%), and Service Call (13.0%).
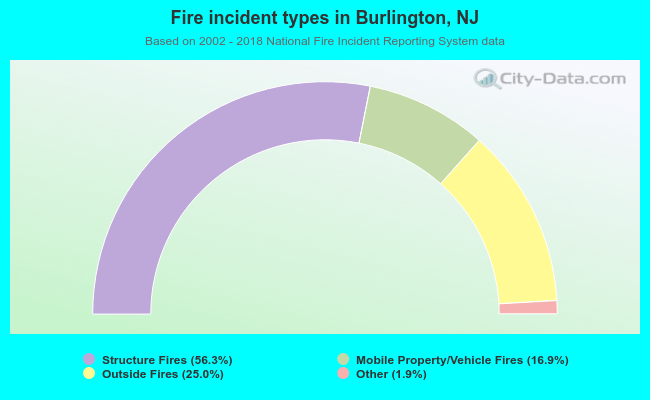 When looking into fire subcategories, the most reports belonged to: Structure Fires (56.3%), and Outside Fires (25.0%).