Cornelius: Fire Incidents, Oregon (OR)
Where are fire incidents reported in Cornelius, OR
Something went wrong! Please refresh the page.
| Fire incidents reported | |
|---|---|
| Sreet name | Count |
| BASELINE ST | 172 |
| ADAIR ST | 76 |
| ALPINE ST | 48 |
| DOGWOOD ST | 42 |
| 4TH AVE | 40 |
| HERGERT RD | 40 |
| 19TH AVE | 34 |
| HEATHER ST | 34 |
| LINDEN ST | 34 |
| 10TH AVE | 30 |
| GOLF COURSE RD | 30 |
| IOWA HILL RD | 24 |
| 13TH AVE | 22 |
| CHERRY ST | 22 |
| DAVIS ST | 22 |
| 26TH AVE | 20 |
| FREMONT ST | 20 |
| HOBBS RD | 20 |
| IVY ST | 20 |
| TONGUE LN | 20 |
| TUALATIN VALLEY HWY | 20 |
| UNGER RD | 20 |
| 12TH AVE | 18 |
| 14TH AVE | 18 |
| FIRDALE RD | 18 |
| GINGER ST | 18 |
| LAFOLLETT RD | 18 |
| 10 AVE | 16 |
| 20TH AVE | 16 |
| 20TH PL | 16 |
| Other | 24 |
2002 - 2018 National Fire Incident Reporting System (NFIRS) incidents
- Incident types reported to NFIRS in Cornelius, OR
- 2,38548.3%Rescue & EMS
- 97219.7%Fire
- 70014.2%Good Intent Call
- 4529.1%Service Call
- 2805.7%Hazardous Condition
- 1392.8%False Alarm
- 90.2%Special Incident
- Fire incident types reported to NFIRS in Cornelius, OR
- 42443.6%Structure Fires
- 42443.6%Outside Fires
- 818.3%Mobile Property/Vehicle Fires
- 434.4%Other
 According to the data from the years 2002 - 2018 the average number of fires per year is 57. The highest number of reported fire incidents - 91 took place in 2003, and the least - 16 in 2017. The data has a dropping trend.
The average number of yearly fire incidents per 10k residents in Cornelius, OR compared to nearest cities:
(Note: Based on data for the last 3 years, including only cities with population 5,000 and above)
| Cornelius: | 24.1 |
| Forest Grove: | 29.4 |
| Hillsboro: | 10.2 |
| Aloha: | 0.9 |
| Beaverton: | 16.8 |
| Tigard: | 12.3 |
| Sherwood: | 7.9 |
| Newberg: | 18.9 |
| Tualatin: | 14.5 |
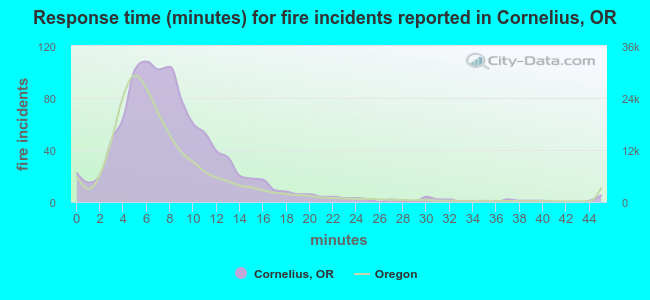 The median response time based on all reported fire incidents is 8 minutes. This is higher compared to the state median value.
The median response time in Cornelius, OR compared to nearest cities:
(Note: Based on data for all years, including only cities with at least 500 fire incidents)
| Cornelius: | 8 minutes |
| Forest Grove: | 8 minutes |
| Hillsboro: | 5 minutes |
| Gaston: | 13 minutes |
| Banks: | 12 minutes |
| Aloha: | 6 minutes |
| Beaverton: | 6 minutes |
| Tigard: | 6 minutes |
| Sherwood: | 7 minutes |
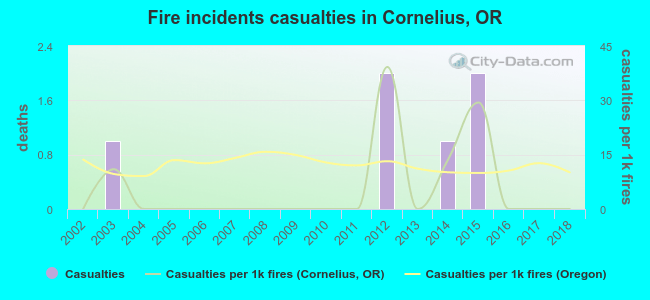 According to the data from the years 2002 - 2018 the average number of fire-related casualties per year is 0. The highest number of casualties - 2 took place in 2012, and the lowest - 0 in 2002. The data has a constant trend.
The average number of injuries per 1,000 fires is 5. This indicator was the highest - 39 in 2012, and the lowest 0 in 2002. The trend for casualties per 1,000 incidents is constant. Compared to the state value the number of injuries per 1,000 fire incidents is lower.
According to the data from the years 2002 - 2018 the average number of fire-related casualties per year is 0. The highest number of casualties - 2 took place in 2012, and the lowest - 0 in 2002. The data has a constant trend.
The average number of injuries per 1,000 fires is 5. This indicator was the highest - 39 in 2012, and the lowest 0 in 2002. The trend for casualties per 1,000 incidents is constant. Compared to the state value the number of injuries per 1,000 fire incidents is lower.
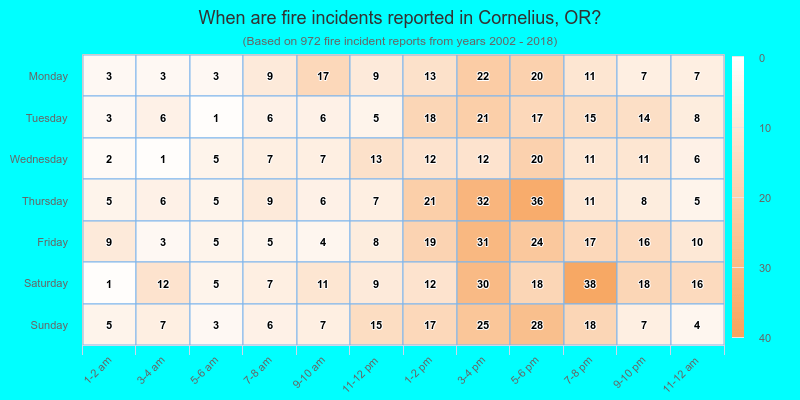
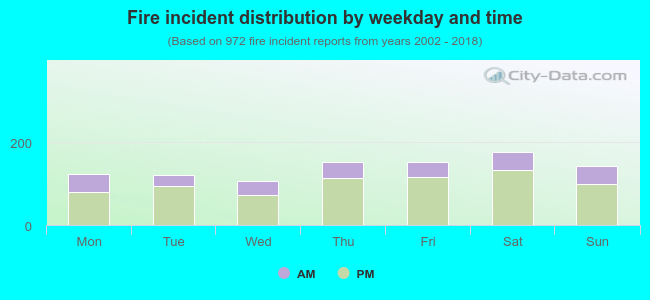 27.4% incidents where reported in the morning and 72.6% in the evening. The most fires (18.2%) took place on Saturday, and the least (11.0%) on Wednesday.
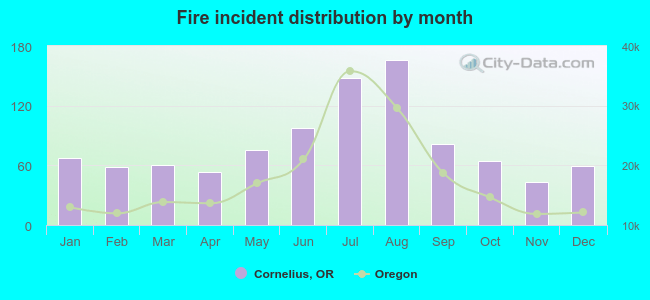 According to the 972 fire incidents from years 2002 - 2018 most fires (17.1%) took place during August, and the least (4.4%) in November.
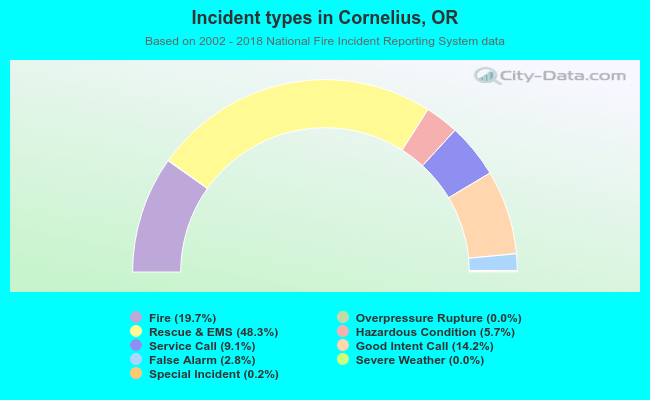 Out of all 4,941 cases reported during the years 2002 - 2018, the most belonged to the categories: Rescue & EMS (48.3%), Fire (19.7%), and Good Intent Call (14.2%).
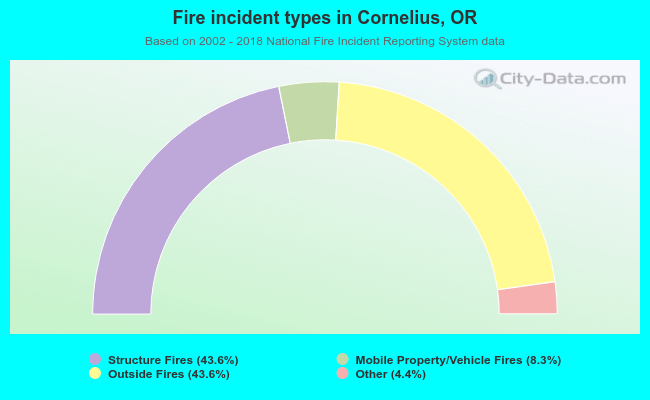 When looking into fire subcategories, the most incidents belonged to: Structure Fires (43.6%), and Outside Fires (43.6%).