Covina: Fire Incidents, California (CA)
Where are fire incidents reported in Covina, CA
Something went wrong! Please refresh the page.
| Fire incidents reported | |
|---|---|
| Sreet name | Count |
| AZUSA | 124 |
| CITRUS | 94 |
| SAN BERNARDINO | 90 |
| BADILLO | 64 |
| GRAND | 48 |
| CYPRESS | 40 |
| COVINA | 38 |
| BARRANCA | 36 |
| GLENDORA | 34 |
| PROSPERO | 34 |
| PUENTE | 34 |
| ARROW | 28 |
| HOLLENBECK | 28 |
| WANAMAKER | 28 |
| EDNA | 26 |
| CIENEGA | 22 |
| ROWLAND | 22 |
| DEXTER | 18 |
| NAVILLA | 16 |
| BENBOW | 14 |
| CONWELL | 14 |
| HURST | 14 |
| LARK ELLEN | 14 |
| RUE ROYALE | 14 |
| 2ND | 12 |
| ARMEL | 12 |
| COLLEGE | 12 |
| GRANDVIEW | 12 |
| RIMSDALE | 12 |
| WORKMAN | 12 |
2005 - 2018 National Fire Incident Reporting System (NFIRS) incidents
- Incident types reported to NFIRS in Covina, CA
- 13,67669.2%Rescue & EMS
- 3,12215.8%Good Intent Call
- 1,1415.8%False Alarm
- 7103.6%Fire
- 5392.7%Hazardous Condition
- 5372.7%Service Call
- 380.2%Special Incident
- Fire incident types reported to NFIRS in Covina, CA
- 30843.4%Outside Fires
- 23833.5%Structure Fires
- 12517.6%Mobile Property/Vehicle Fires
- 395.5%Other
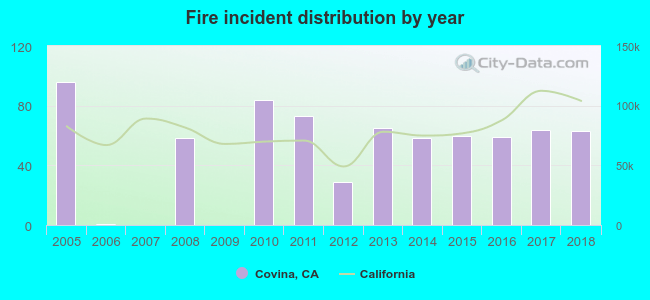 According to the data from the years 2005 - 2018 the average number of fires per year is 51. The highest number of fires - 96 took place in 2005, and the least - 0 in 2007. The data has a decreasing trend.
The average number of yearly fire incidents per 10k residents in Covina, CA compared to nearest cities:
(Note: Based on data for the last 3 years, including only cities with population 5,000 and above)
| Covina: | 12.7 |
| Charter Oak: | 6.4 |
| Glendora: | 14.1 |
| Azusa: | 13.9 |
| West Covina: | 5.2 |
| San Dimas: | 14.6 |
| Walnut: | 8.6 |
| Valinda: | 10.2 |
| Baldwin Park: | 8.9 |
 The median response time based on all reported fire incidents is 4 minutes. This is lower compared to the state median value.
The median response time in Covina, CA compared to nearest cities:
(Note: Based on data for all years, including only cities with at least 500 fire incidents)
| Covina: | 4 minutes |
| Glendora: | 5 minutes |
| Azusa: | 5 minutes |
| West Covina: | 6 minutes |
| San Dimas: | 5 minutes |
| Baldwin Park: | 5 minutes |
| La Verne: | 5 minutes |
| Industry: | 6 minutes |
| Diamond Bar: | 6 minutes |
 30.6% incidents where reported in the morning and 69.4% in the evening. The most fires (15.2%) took place on Saturday, and the least (13.2%) on Wednesday.
 Based on the 710 incident reports from years 2005 - 2018 most fires (11.5%) took place during July, and the least (5.9%) in October.
 Out of all 19,773 cases reported during the years 2005 - 2018, the most belonged to the categories: Rescue & EMS (69.2%), Good Intent Call (15.8%), and False Alarm (5.8%).
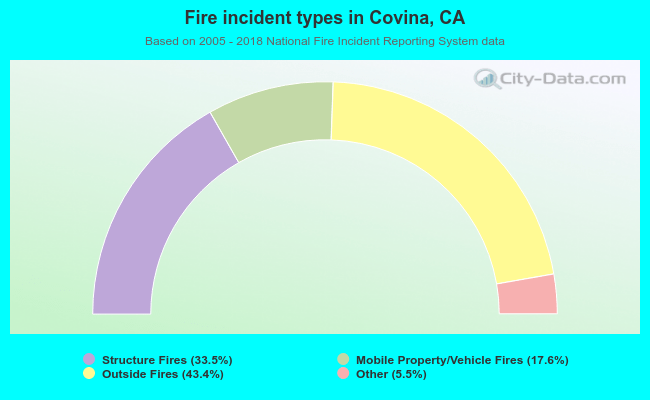 When looking into fire subcategories, the most reports belonged to: Outside Fires (43.4%), and Structure Fires (33.5%).