Defiance: Fire Incidents, Ohio (OH)
Where are fire incidents reported in Defiance, OH
Something went wrong! Please refresh the page.
| Fire incidents reported | |
|---|---|
| Sreet name | Count |
| CLINTON ST | 146 |
| CLINTON | 122 |
| BOWMAN RD | 76 |
| ST RT 66 HWY | 76 |
| JACKSON | 66 |
| WATSON RD | 64 |
| SECOND ST | 58 |
| ST RT 66 | 58 |
| CHRISTY RD | 54 |
| FLORY RD | 54 |
| HOFFMAN RD | 52 |
| ST RT 15 | 52 |
| PERRY ST | 50 |
| DOMERSVILLE RD | 46 |
| HARRISON | 46 |
| DOHONEY RD | 44 |
| HOPKINS | 44 |
| CARPENTER RD | 42 |
| HOLGATE AVE | 42 |
| RALSTON AVE | 42 |
| ST. RT. 15 | 40 |
| HILL AVE | 38 |
| AYERSVILLE AVE | 36 |
| EAST SECOND ST | 36 |
| FULLMER RD | 36 |
| JEFFERSON | 36 |
| ST RT 111 | 36 |
| STANDLEY RD | 36 |
| BLANCHARD RD | 32 |
| FRUIT RIDGE RD | 32 |
| Other | 1,652 |
2002 - 2018 National Fire Incident Reporting System (NFIRS) incidents
- Incident types reported to NFIRS in Defiance, OH
- 9,78758.4%Rescue & EMS
- 3,24419.4%Fire
- 1,67910.0%Hazardous Condition
- 8815.3%Service Call
- 6243.7%False Alarm
- 4532.7%Good Intent Call
- 390.2%Special Incident
- 330.2%Severe Weather
- 220.1%Overpressure Rupture
- Fire incident types reported to NFIRS in Defiance, OH
- 1,77054.6%Structure Fires
- 1,04632.2%Outside Fires
- 39212.1%Mobile Property/Vehicle Fires
- 361.1%Other
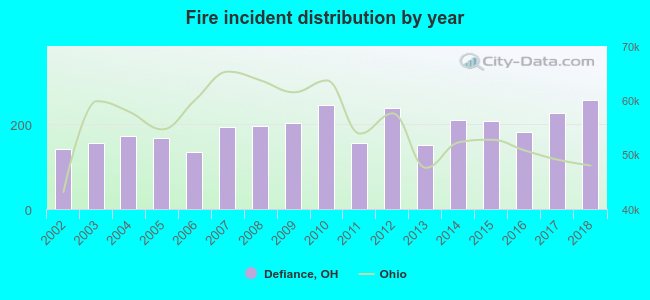 According to the data from the years 2002 - 2018 the average number of fires per year is 191. The highest number of reported fire incidents - 257 took place in 2018, and the least - 134 in 2006. The data has a growing trend.
 The median response time based on all reported fire incidents is 8 minutes. This is higher compared to the Ohio median value.
The median response time in Defiance, OH compared to nearest cities:
(Note: Based on data for all years, including only cities with at least 500 fire incidents)
| Defiance: | 8 minutes |
| Napoleon: | 7 minutes |
| Paulding: | 12 minutes |
| Bryan: | 7 minutes |
| Archbold: | 6 minutes |
| Hicksville: | 7 minutes |
| Wauseon: | 7 minutes |
| Montpelier: | 8 minutes |
| Ottawa: | 7 minutes |
 According to the data from the years 2002 - 2018 the average number of fire-related yearly deaths is 0. The highest number of reported deaths - 3 took place in 2017, and the lowest - 0 in 2002. The data has a growing trend.
The average number of fatalities per 1,000 fires is 2. This indicator was the highest - 13 in 2017, and the lowest 0 in 2002. The trend for fatalities per 1,000 fires is rising. Compared to the state value the number of deaths per 1,000 fire incidents is similar.
According to the data from the years 2002 - 2018 the average number of fire-related yearly deaths is 0. The highest number of reported deaths - 3 took place in 2017, and the lowest - 0 in 2002. The data has a growing trend.
The average number of fatalities per 1,000 fires is 2. This indicator was the highest - 13 in 2017, and the lowest 0 in 2002. The trend for fatalities per 1,000 fires is rising. Compared to the state value the number of deaths per 1,000 fire incidents is similar.Deaths per 1,000 incidents in Defiance, OH compared to nearest cities:
(Note: Based on data for all years, including only cities with at least 2,500 fire incidents)
| Defiance: | 2.2 |
 According to the data from the years 2002 - 2018 the average number of fire-related yearly casualties is 3. The highest number of reported injuries - 8 took place in 2008, and the lowest - 0 in 2003. The data has a dropping trend.
The average number of injuries per 1,000 fire incidents is 14. This indicator was the highest - 41 in 2004, and the lowest 0 in 2003. The trend for injuries per 1,000 incidents is dropping. Compared to the state value the number of injuries per 1,000 incidents is similar.
According to the data from the years 2002 - 2018 the average number of fire-related yearly casualties is 3. The highest number of reported injuries - 8 took place in 2008, and the lowest - 0 in 2003. The data has a dropping trend.
The average number of injuries per 1,000 fire incidents is 14. This indicator was the highest - 41 in 2004, and the lowest 0 in 2003. The trend for injuries per 1,000 incidents is dropping. Compared to the state value the number of injuries per 1,000 incidents is similar.Casualties per 1,000 incidents in Defiance, OH compared to nearest cities:
(Note: Based on data for all years, including only cities with at least 500 fire incidents)
| Defiance: | 13.6 |
| Napoleon: | 32.3 |
| Paulding: | 1.9 |
| Bryan: | 38.6 |
| Archbold: | 10.0 |
| Hicksville: | 3.0 |
| Wauseon: | 22.3 |
| Montpelier: | 8.6 |
| Ottawa: | 3.4 |
 32.0% incidents where reported in the morning and 68.0% in the evening. The most fires (15.8%) took place on Friday, and the least (12.5%) on Wednesday.
 According to the 3,244 fire incidents from years 2002 - 2018 most fires (11.1%) took place during April, and the least (6.4%) in February.
 Out of all 16,762 cases reported during the years 2002 - 2018, the most belonged to the categories: Rescue & EMS (58.4%), Fire (19.4%), and Hazardous Condition (10.0%).
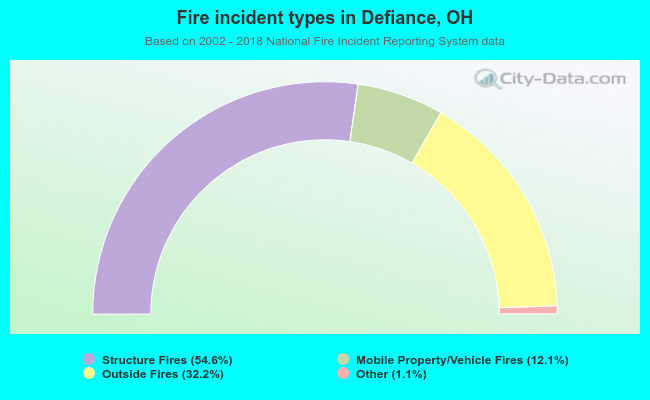 When looking into fire subcategories, the most reports belonged to: Structure Fires (54.6%), and Outside Fires (32.2%).