Deming: Fire Incidents, New Mexico (NM)
Where are fire incidents reported in Deming, NM
Something went wrong! Please refresh the page.
| Fire incidents reported | |
|---|---|
| Sreet name | Count |
| PINE ST | 154 |
| 8TH ST | 78 |
| GOLD AVE | 74 |
| ASH ST | 66 |
| SILVER AVE | 62 |
| SPRUCE ST | 58 |
| TIN ST | 58 |
| COLUMBUS RD | 54 |
| FLORIDA ST | 54 |
| COUNTRY CLUB RD | 48 |
| MAPLE ST | 48 |
| IRON ST | 44 |
| PLATINUM AVE | 42 |
| DIAMOND ST | 40 |
| FIRST ST | 40 |
| NICKEL ST | 38 |
| I-10 HWY | 36 |
| PEAR ST | 36 |
| INTERSTATE 10 | 34 |
| BIRCH ST | 32 |
| FOURTH ST | 30 |
| OAK ST | 30 |
| SAN MIGUEL ST | 30 |
| GRANITE ST | 28 |
| RUBY AVE | 28 |
| COPPER ST | 26 |
| CEDAR ST | 24 |
| KEELER RD | 24 |
| LEAD ST | 24 |
| POPLAR ST | 24 |
| Other | 618 |
2002 - 2018 National Fire Incident Reporting System (NFIRS) incidents
- Incident types reported to NFIRS in Deming, NM
- 12,53581.2%Rescue & EMS
- 1,98212.8%Fire
- 5093.3%Hazardous Condition
- 1931.3%False Alarm
- 1210.8%Service Call
- 710.5%Good Intent Call
- Fire incident types reported to NFIRS in Deming, NM
- 1,17859.4%Outside Fires
- 42221.3%Structure Fires
- 26713.5%Mobile Property/Vehicle Fires
- 1155.8%Other
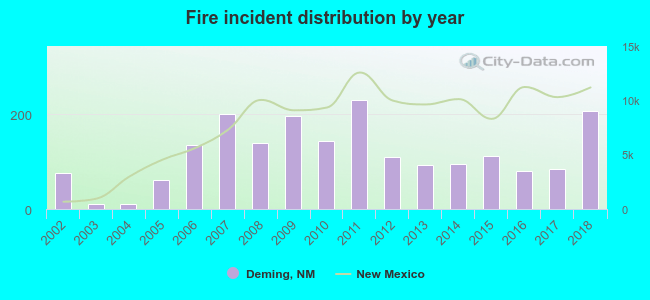 Based on the data from the years 2002 - 2018 the average number of fire incidents per year is 117. The highest number of reported fires - 229 took place in 2011, and the least - 11 in 2003. The data has a rising trend.
The average number of yearly fire incidents per 10k residents in Deming, NM compared to nearest cities:
(Note: Based on data for the last 3 years, including only cities with population 5,000 and above)
| Deming: | 84.9 |
| Fairacres: | 59.4 |
| Silver City: | 87.8 |
| Las Cruces: | 24.8 |
| Anthony: | 60.5 |
| Sunland Park: | 25.5 |
| Chaparral: | 92.3 |
 The median response time based on all reported fire incidents is 7 minutes. This is close to the state median value.
The median response time in Deming, NM compared to nearest cities:
(Note: Based on data for all years, including only cities with at least 500 fire incidents)
| Deming: | 7 minutes |
| Silver City: | 6 minutes |
| Las Cruces: | 6 minutes |
| Anthony: | 12 minutes |
| Chaparral: | 8 minutes |
 Based on the reports from the years 2002 - 2018 the average number of fire-related yearly casualties is 0. The highest number of reported casualties - 1 took place in 2004, and the lowest - 0 in 2002. The data has a constant trend.
The average number of casualties per 1,000 fires is 7. This indicator was the highest - 91 in 2004, and the lowest 0 in 2002. The trend for casualties per 1,000 incidents is rising. Compared to the New Mexico value the number of injuries per 1,000 incidents is higher.
Based on the reports from the years 2002 - 2018 the average number of fire-related yearly casualties is 0. The highest number of reported casualties - 1 took place in 2004, and the lowest - 0 in 2002. The data has a constant trend.
The average number of casualties per 1,000 fires is 7. This indicator was the highest - 91 in 2004, and the lowest 0 in 2002. The trend for casualties per 1,000 incidents is rising. Compared to the New Mexico value the number of injuries per 1,000 incidents is higher.Casualties per 1,000 incidents in Deming, NM compared to nearest cities:
(Note: Based on data for all years, including only cities with at least 500 fire incidents)
| Deming: | 3.0 |
| Silver City: | 6.6 |
| Las Cruces: | 3.1 |
| Anthony: | 0.0 |
| Chaparral: | 0.0 |
 30.1% incidents where reported in the morning and 69.9% in the evening. The most fires (15.4%) took place on Friday, and the least (13.7%) on Thursday.
 Based on the 1,982 reports from years 2002 - 2018 most fires (12.0%) took place during June, and the least (6.0%) in September.
 Out of all 15,429 cases reported during the years 2002 - 2018, the most belonged to the categories: Rescue & EMS (81.2%), Fire (12.8%), and Hazardous Condition (3.3%).
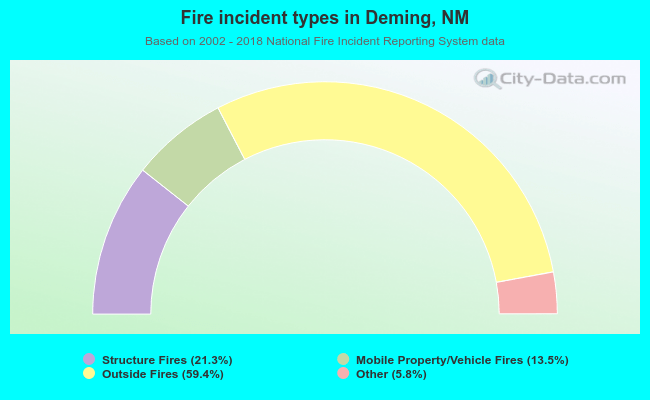 When looking into fire subcategories, the most incidents belonged to: Outside Fires (59.4%), and Structure Fires (21.3%).