East Haven: Fire Incidents, Connecticut (CT)
Where are fire incidents reported in East Haven, CT
Something went wrong! Please refresh the page.
| Fire incidents reported | |
|---|---|
| Sreet name | Count |
| MAIN ST | 236 |
| FOXON RD | 178 |
| FRONTAGE RD | 160 |
| HEMINGWAY AVE | 140 |
| THOMPSON ST | 90 |
| NORTH HIGH ST | 78 |
| SHORT BEACH RD | 64 |
| COE AVE | 62 |
| GERRISH AVE | 56 |
| OLD FOXON RD | 54 |
| SILVER SANDS RD | 54 |
| COSEY BEACH AVE | 52 |
| BARBERRY RD | 46 |
| I-95 | 44 |
| MILL ST | 44 |
| COMMERCE ST | 42 |
| MICHAEL ST | 40 |
| LAUREL ST | 38 |
| MANSFIELD GROVE RD | 38 |
| THOMPSON AVE | 34 |
| BRADLEY ST | 32 |
| HIGH ST | 32 |
| ELLIOT ST | 30 |
| TYLER ST | 30 |
| WARNER RD | 30 |
| KENNETH ST | 28 |
| FOXON BLVD | 26 |
| MEADOW ST | 26 |
| SALTONSTALL | 26 |
| MESSINA DR | 24 |
2002 - 2018 National Fire Incident Reporting System (NFIRS) incidents
- Incident types reported to NFIRS in East Haven, CT
- 22,00171.6%Rescue & EMS
- 2,7649.0%Service Call
- 1,7355.6%Fire
- 1,5455.0%Hazardous Condition
- 1,3374.4%False Alarm
- 1,2894.2%Good Intent Call
- Fire incident types reported to NFIRS in East Haven, CT
- 67739.0%Structure Fires
- 62335.9%Outside Fires
- 25514.7%Mobile Property/Vehicle Fires
- 18010.4%Other
 According to the data from the years 2002 - 2018 the average number of fire incidents per year is 102. The highest number of fires - 148 took place in 2012, and the least - 37 in 2005. The data has a dropping trend.
The average number of yearly fire incidents per 10k residents in East Haven, CT compared to nearest cities:
(Note: Based on data for the last 3 years, including only cities with population 5,000 and above)
| East Haven: | 30.2 |
| Branford: | 31.0 |
| New Haven: | 29.0 |
| West Haven: | 47.2 |
| Hamden: | 29.3 |
| North Branford: | 19.0 |
| North Haven: | 56.3 |
| Orange: | 34.2 |
| Woodbridge: | 51.2 |
 The median response time based on all reported fire incidents is 4 minutes. This is lower than the state median value.
The median response time in East Haven, CT compared to nearest cities:
(Note: Based on data for all years, including only cities with at least 500 fire incidents)
| East Haven: | 4 minutes |
| Branford: | 5 minutes |
| New Haven: | 4 minutes |
| West Haven: | 4 minutes |
| Hamden: | 4 minutes |
| North Branford: | 6 minutes |
| North Haven: | 6 minutes |
| Orange: | 5 minutes |
| Guilford: | 5 minutes |
 Based on the data from the years 2002 - 2018 the average number of fire-related casualties per year is 2. The highest number of reported casualties - 6 took place in 2007, and the lowest - 0 in 2005. The data has a constant trend.
The average number of injuries per 1,000 fires is 23. This indicator was the highest - 59 in 2016, and the lowest 0 in 2005. The trend for injuries per 1,000 fire incidents is increasing. Compared to the state value the number of casualties per 1,000 incidents is higher.
Based on the data from the years 2002 - 2018 the average number of fire-related casualties per year is 2. The highest number of reported casualties - 6 took place in 2007, and the lowest - 0 in 2005. The data has a constant trend.
The average number of injuries per 1,000 fires is 23. This indicator was the highest - 59 in 2016, and the lowest 0 in 2005. The trend for injuries per 1,000 fire incidents is increasing. Compared to the state value the number of casualties per 1,000 incidents is higher.Casualties per 1,000 incidents in East Haven, CT compared to nearest cities:
(Note: Based on data for all years, including only cities with at least 500 fire incidents)
| East Haven: | 23.6 |
| Branford: | 18.7 |
| New Haven: | 2.7 |
| West Haven: | 13.6 |
| Hamden: | 15.1 |
| North Branford: | 20.1 |
| North Haven: | 14.9 |
| Orange: | 14.3 |
| Guilford: | 6.8 |
 27.4% incidents where reported in the morning and 72.6% in the evening. The most fires (15.6%) took place on Saturday, and the least (13.0%) on Wednesday.
 Based on the 1,735 fires from years 2002 - 2018 most fires (11.2%) took place during April, and the least (6.0%) in February.
 Out of all 30,733 cases reported during the years 2002 - 2018, the most belonged to the categories: Rescue & EMS (71.6%), Service Call (9.0%), and Fire (5.6%).
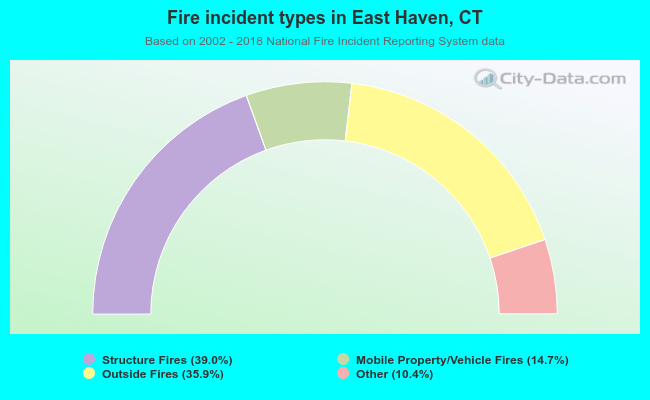 When looking into fire subcategories, the most reports belonged to: Structure Fires (39.0%), and Outside Fires (35.9%).