Emeryville: Fire Incidents, California (CA)
Where are fire incidents reported in Emeryville, CA
Something went wrong! Please refresh the page.
|
| |||||||||||||||||||||||||||||||||||||||||||||||||||||||||||||||||||||||||||||||||||||||||||||||||||||||||||||
2005 - 2018 National Fire Incident Reporting System (NFIRS) incidents
- Incident types reported to NFIRS in Emeryville, CA
- 3,91861.0%Rescue & EMS
- 1,13217.6%Good Intent Call
- 76211.9%False Alarm
- 2554.0%Fire
- 2153.3%Service Call
- 1282.0%Hazardous Condition
- Fire incident types reported to NFIRS in Emeryville, CA
- 10942.7%Outside Fires
- 9135.7%Structure Fires
- 5019.6%Mobile Property/Vehicle Fires
- 52.0%Other
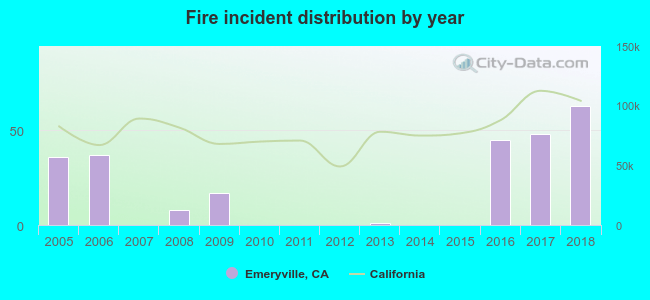 Based on the data from the years 2005 - 2018 the average number of fires per year is 18. The highest number of fire incidents - 63 took place in 2018, and the least - 0 in 2007. The data has an increasing trend.
The average number of yearly fire incidents per 10k residents in Emeryville, CA compared to nearest cities:
(Note: Based on data for the last 3 years, including only cities with population 5,000 and above)
| Emeryville: | 46.3 |
| Berkeley: | 22.9 |
| Piedmont: | 10.7 |
| Albany: | 19.3 |
| Oakland: | 37.6 |
| Kensington: | 11.2 |
| Alameda: | 20.8 |
| El Cerrito: | 25.2 |
| Orinda: | 26.1 |

 31.4% incidents where reported in the morning and 68.6% in the evening. The most fires (17.6%) took place on Saturday, and the least (12.9%) on Sunday.
 According to the 255 incident reports from years 2005 - 2018 most fires (12.9%) took place during September, and the least (5.1%) in December.
 Out of all 6,419 cases reported during the years 2005 - 2018, the most belonged to the categories: Rescue & EMS (61.0%), Good Intent Call (17.6%), and False Alarm (11.9%).
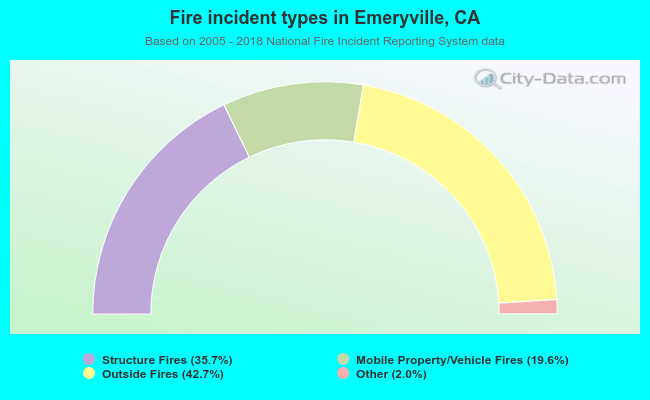 When looking into fire subcategories, the most reports belonged to: Outside Fires (42.7%), and Structure Fires (35.7%).