Grove: Fire Incidents, Oklahoma (OK)
Where are fire incidents reported in Grove, OK
Something went wrong! Please refresh the page.
|
| |||||||||||||||||||||||||||||||||||||||||||||||||||||||||||||||||||||||||||||||||||||||||||||||||||||||||||||
| Other | 321 | |||||||||||||||||||||||||||||||||||||||||||||||||||||||||||||||||||||||||||||||||||||||||||||||||||||||||||||
2002 - 2018 National Fire Incident Reporting System (NFIRS) incidents
- Incident types reported to NFIRS in Grove, OK
- 6,49263.9%Rescue & EMS
- 1,59715.7%Fire
- 8678.5%Good Intent Call
- 5945.8%Hazardous Condition
- 3133.1%Service Call
- 2552.5%False Alarm
- 270.3%Severe Weather
- 140.1%Special Incident
- Fire incident types reported to NFIRS in Grove, OK
- 70544.1%Outside Fires
- 63339.6%Structure Fires
- 1338.3%Mobile Property/Vehicle Fires
- 1267.9%Other
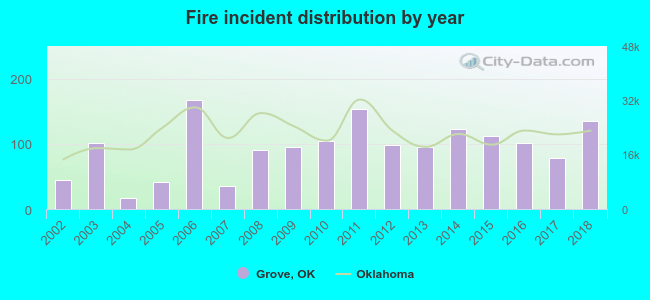 Based on the data from the years 2002 - 2018 the average number of fire incidents per year is 94. The highest number of fires - 167 took place in 2006, and the least - 17 in 2004. The data has a rising trend.
 The median response time based on all reported fire incidents is 9 minutes. This is higher than the Oklahoma median value.
 31.4% incidents where reported in the morning and 68.6% in the evening. The most fires (16.3%) took place on Saturday, and the least (12.8%) on Sunday.
 Based on the 1,597 fire incident reports from years 2002 - 2018 most fires (13.3%) took place during January, and the least (4.1%) in September.
 Out of all 10,164 cases reported during the years 2002 - 2018, the most belonged to the categories: Rescue & EMS (63.9%), Fire (15.7%), and Good Intent Call (8.5%).
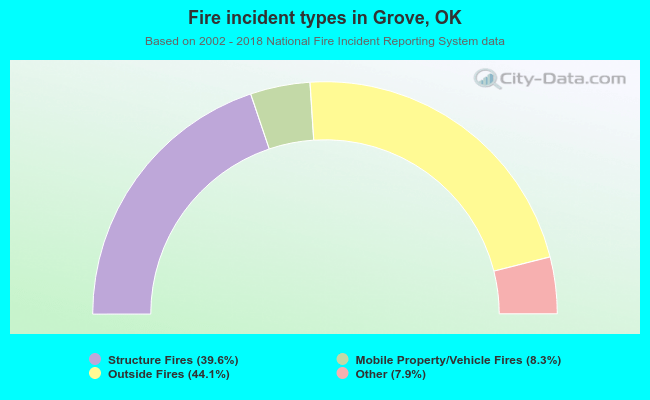 When looking into fire subcategories, the most reports belonged to: Outside Fires (44.1%), and Structure Fires (39.6%).