Harrisonburg: Fire Incidents, Virginia (VA)
Where are fire incidents reported in Harrisonburg, VA
Something went wrong! Please refresh the page.
| Fire incidents reported | |
|---|---|
| Sreet name | Count |
| MAIN ST | 358 |
| MARKET ST | 240 |
| INTERSTATE 81 | 198 |
| KRATZER RD | 154 |
| PORT REPUBLIC RD | 140 |
| DEVON LN | 132 |
| HIGH ST | 122 |
| VALLEY PIKE | 86 |
| VINE ST | 86 |
| LIBERTY ST | 80 |
| BURGESS RD | 76 |
| PLEASANT VALLEY RD | 72 |
| CHESTNUT RIDGE DR | 70 |
| SOUTH AVE | 70 |
| RESERVOIR ST | 62 |
| CARRIER DR | 56 |
| RAWLEY PIKE | 54 |
| MASON ST | 50 |
| GAY ST | 48 |
| BLUESTONE DR | 46 |
| COUNTRY CLUB CT | 46 |
| OLD FURNACE RD | 46 |
| UNIVERSITY BLVD | 46 |
| VIRGINIA AVE | 46 |
| HARPINE HWY | 44 |
| INDIAN TRAIL RD | 40 |
| JOHN WAYLAND HWY | 40 |
| MOUNT CLINTON PIKE | 40 |
| SPOTSWOOD TRL | 40 |
| LOIS LN | 36 |
| Other | 798 |
2002 - 2018 National Fire Incident Reporting System (NFIRS) incidents
- Incident types reported to NFIRS in Harrisonburg, VA
- 7,42237.5%Rescue & EMS
- 3,55318.0%Hazardous Condition
- 3,42217.3%Fire
- 2,51612.7%Good Intent Call
- 1,7528.9%False Alarm
- 1,0895.5%Service Call
- Fire incident types reported to NFIRS in Harrisonburg, VA
- 1,63547.8%Structure Fires
- 1,16234.0%Outside Fires
- 46513.6%Mobile Property/Vehicle Fires
- 1604.7%Other
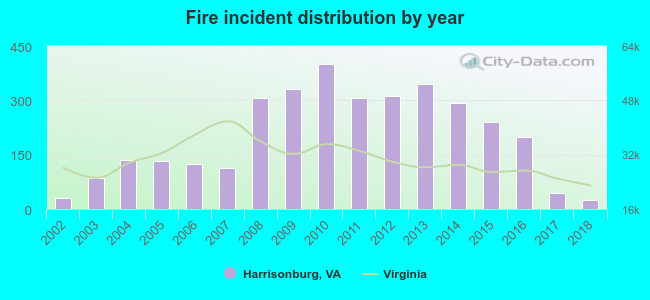 Based on the data from the years 2002 - 2018 the average number of fire incidents per year is 201. The highest number of reported fire incidents - 400 took place in 2010, and the least - 25 in 2018. The data has a declining trend.
The average number of yearly fire incidents per 10k residents in Harrisonburg, VA compared to nearest cities:
(Note: Based on data for the last 3 years, including only cities with population 5,000 and above)
| Harrisonburg: | 17.0 |
| Bridgewater: | 29.7 |
| Staunton: | 46.5 |
| Fishersville: | 39.8 |
| Waynesboro: | 53.7 |
| Crozet: | 24.0 |
| Stuarts Draft: | 41.9 |
| Charlottesville: | 70.8 |
| Woodstock: | 77.8 |
 The median response time based on all reported fire incidents is 6 minutes. This is about the same as the Virginia median value.
The median response time in Harrisonburg, VA compared to nearest cities:
(Note: Based on data for all years, including only cities with at least 500 fire incidents)
| Harrisonburg: | 6 minutes |
| Bridgewater: | 11 minutes |
| Broadway: | 11 minutes |
| Grottoes: | 9 minutes |
| Elkton: | 10 minutes |
| Verona: | 9 minutes |
| Churchville: | 12 minutes |
| Stanley: | 7 minutes |
| Staunton: | 7 minutes |
 According to the reports from the years 2002 - 2018 the average number of fire-related fatalities per year is 0. The highest number of deaths - 2 took place in 2013, and the lowest - 0 in 2002. The data has a constant trend.
The average number of fatalities per 1,000 fires is 2. This indicator was the highest - 12 in 2003, and the lowest 0 in 2002. The trend for fatalities per 1,000 fire incidents is constant. Compared to the Virginia value the number of fatalities per 1,000 fire incidents is about the same.
According to the reports from the years 2002 - 2018 the average number of fire-related fatalities per year is 0. The highest number of deaths - 2 took place in 2013, and the lowest - 0 in 2002. The data has a constant trend.
The average number of fatalities per 1,000 fires is 2. This indicator was the highest - 12 in 2003, and the lowest 0 in 2002. The trend for fatalities per 1,000 fire incidents is constant. Compared to the Virginia value the number of fatalities per 1,000 fire incidents is about the same.Deaths per 1,000 incidents in Harrisonburg, VA compared to nearest cities:
(Note: Based on data for all years, including only cities with at least 2,500 fire incidents)
| Harrisonburg: | 2.0 |
| Staunton: | 0.8 |
| Charlottesville: | 1.1 |
| Front Royal: | 1.1 |
 According to the reports from the years 2002 - 2018 the average number of fire-related yearly casualties is 4. The highest number of casualties - 10 took place in 2016, and the lowest - 0 in 2002. The data has a constant trend.
The average number of injuries per 1,000 fires is 14. This indicator was the highest - 51 in 2016, and the lowest 0 in 2002. The trend for casualties per 1,000 fires is constant. Compared to the Virginia value the number of casualties per 1,000 fire incidents is higher.
According to the reports from the years 2002 - 2018 the average number of fire-related yearly casualties is 4. The highest number of casualties - 10 took place in 2016, and the lowest - 0 in 2002. The data has a constant trend.
The average number of injuries per 1,000 fires is 14. This indicator was the highest - 51 in 2016, and the lowest 0 in 2002. The trend for casualties per 1,000 fires is constant. Compared to the Virginia value the number of casualties per 1,000 fire incidents is higher.Casualties per 1,000 incidents in Harrisonburg, VA compared to nearest cities:
(Note: Based on data for all years, including only cities with at least 500 fire incidents)
| Harrisonburg: | 17.8 |
| Bridgewater: | 10.1 |
| Broadway: | 5.3 |
| Grottoes: | 4.8 |
| Elkton: | 4.5 |
| Verona: | 16.2 |
| Churchville: | 3.1 |
| Stanley: | 25.0 |
| Staunton: | 13.2 |
 31.8% incidents where reported in the morning and 68.2% in the evening. The most fires (15.5%) took place on Saturday, and the least (12.9%) on Tuesday.
 Based on the 3,422 reports from years 2002 - 2018 most fires (11.5%) took place during April, and the least (6.9%) in October.
 Out of all 19,790 cases reported during the years 2002 - 2018, the most belonged to the categories: Rescue & EMS (37.5%), Hazardous Condition (18.0%), and Fire (17.3%).
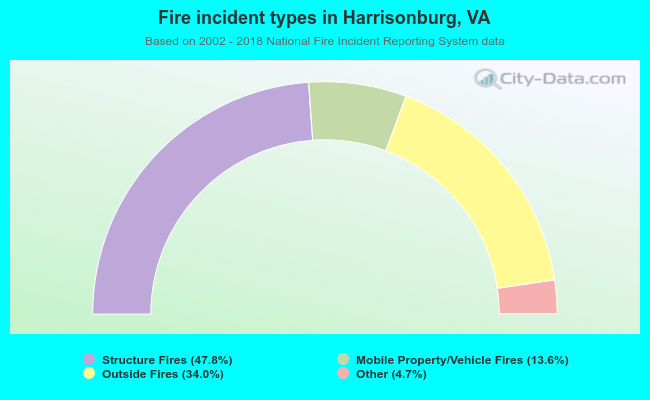 When looking into fire subcategories, the most incidents belonged to: Structure Fires (47.8%), and Outside Fires (34.0%).