Hitchcock: Fire Incidents, Texas (TX)
Where are fire incidents reported in Hitchcock, TX
Something went wrong! Please refresh the page.
|
| |||||||||||||||||||||||||||||||||||||||||||||||||||||||||||||||||||||||||||||||||||||||||||||||||||||||||||||
2002 - 2018 National Fire Incident Reporting System (NFIRS) incidents
- Incident types reported to NFIRS in Hitchcock, TX
- 77430.6%Fire
- 70327.8%Rescue & EMS
- 59223.4%Hazardous Condition
- 2198.7%Good Intent Call
- 1596.3%Service Call
- 732.9%False Alarm
- 60.2%Overpressure Rupture
- Fire incident types reported to NFIRS in Hitchcock, TX
- 33242.9%Outside Fires
- 31140.2%Structure Fires
- 11014.2%Mobile Property/Vehicle Fires
- 212.7%Other
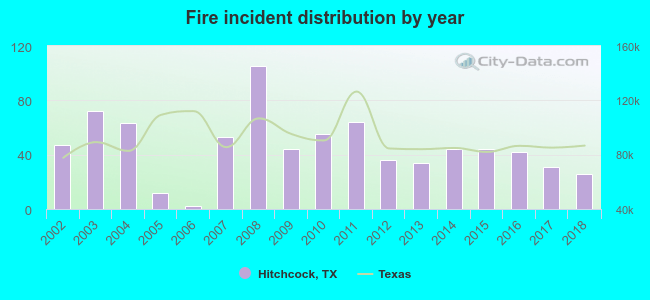 Based on the data from the years 2002 - 2018 the average number of fires per year is 46. The highest number of fires - 105 took place in 2008, and the least - 2 in 2006. The data has a declining trend.
The average number of yearly fire incidents per 10k residents in Hitchcock, TX compared to nearest cities:
(Note: Based on data for the last 3 years, including only cities with population 5,000 and above)
| Hitchcock: | 44.3 |
| La Marque: | 41.9 |
| Texas City: | 44.2 |
| Santa Fe: | 71.3 |
| Dickinson: | 40.8 |
| Bacliff: | 40.6 |
| Galveston: | 54.6 |
| League City: | 15.7 |
| Webster: | 63.6 |
 The median response time based on all reported fire incidents is 8 minutes. This is higher compared to the state median value.
The median response time in Hitchcock, TX compared to nearest cities:
(Note: Based on data for all years, including only cities with at least 500 fire incidents)
| Hitchcock: | 8 minutes |
| La Marque: | 5 minutes |
| Texas City: | 6 minutes |
| Santa Fe: | 7 minutes |
| Dickinson: | 6 minutes |
| Galveston: | 4 minutes |
| League City: | 7 minutes |
| Webster: | 5 minutes |
| Seabrook: | 8 minutes |
 According to the reports from the years 2002 - 2018 the average number of fire-related yearly deaths is 0. The highest number of deaths - 1 took place in 2002, and the lowest - 0 in 2003. The data has a declining trend.
 31.5% incidents where reported in the morning and 68.5% in the evening. The most fires (16.7%) took place on Sunday, and the least (12.0%) on Thursday.
 Based on the 774 reports from years 2002 - 2018 most fires (9.7%) took place during May, and the least (6.2%) in January.
 Out of all 2,528 cases reported during the years 2002 - 2018, the most belonged to the categories: Fire (30.6%), Rescue & EMS (27.8%), and Hazardous Condition (23.4%).
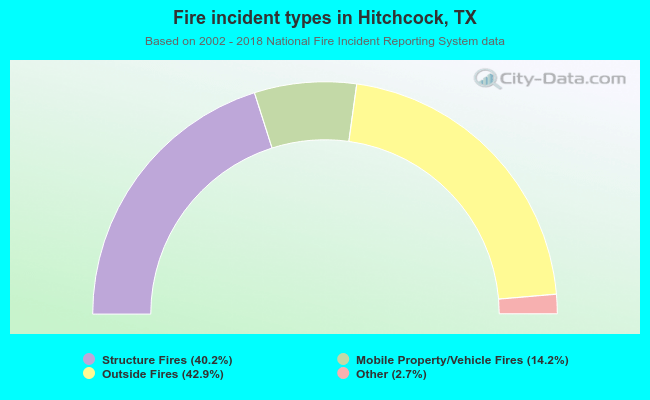 When looking into fire subcategories, the most reports belonged to: Outside Fires (42.9%), and Structure Fires (40.2%).