Leesburg: Fire Incidents, Virginia (VA)
Where are fire incidents reported in Leesburg, VA
Something went wrong! Please refresh the page.
| Fire incidents reported | |
|---|---|
| Sreet name | Count |
| FORT EVANS RD | 114 |
| MARKET ST | 88 |
| EDWARDS FERRY RD | 78 |
| JAMES MONROE HWY | 72 |
| CATOCTIN CIR | 70 |
| KING ST | 64 |
| EDWARDS FERRY RD NE-LB | 60 |
| EVERGREEN MILLS RD | 58 |
| MARKET ST E-LB | 56 |
| FORT EVANS RD NE-LB | 40 |
| PLAZA ST | 40 |
| FORT EVANS RD NE-LB RD | 34 |
| KING ST S-LB | 26 |
| SYCOLIN RD | 26 |
| ADAMS DR | 24 |
| EVERGREEN MILLS RD (621) | 24 |
| HUNTMASTER TER | 24 |
| PLAZA ST NE-LB | 24 |
| CLARK CT | 22 |
| HARRY BYRD HWY | 22 |
| JAMES MONROE HWY (15) | 22 |
| LOUDOUN ST | 20 |
| HARRISON ST | 18 |
| HERITAGE WAY | 18 |
| JAMES MONROE HWY | 18 |
| TAYLORSTOWN RD | 18 |
| CANBY RD | 16 |
| DULLES GREENWAY (267) | 16 |
| EDWARDS FERRY RD NE-LB RD | 16 |
| FIELDSTONE DR | 16 |
| Other | 1,366 |
2002 - 2018 National Fire Incident Reporting System (NFIRS) incidents
- Incident types reported to NFIRS in Leesburg, VA
- 4,08027.1%Rescue & EMS
- 3,24921.6%Hazardous Condition
- 2,70518.0%Good Intent Call
- 2,51016.7%Fire
- 1,2948.6%False Alarm
- 9476.3%Service Call
- 1501.0%Special Incident
- 670.4%Severe Weather
- 360.2%Overpressure Rupture
- Fire incident types reported to NFIRS in Leesburg, VA
- 1,27350.7%Structure Fires
- 82532.9%Outside Fires
- 2419.6%Mobile Property/Vehicle Fires
- 1716.8%Other
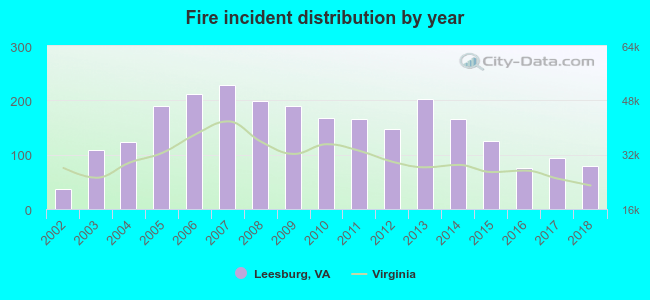 Based on the data from the years 2002 - 2018 the average number of fire incidents per year is 148. The highest number of reported fires - 229 took place in 2007, and the least - 36 in 2002. The data has a growing trend.
The average number of yearly fire incidents per 10k residents in Leesburg, VA compared to nearest cities:
(Note: Based on data for the last 3 years, including only cities with population 5,000 and above)
| Leesburg: | 16.7 |
| Lansdowne: | 0.9 |
| Ashburn: | 31.0 |
| Purcellville: | 67.2 |
| Sterling: | 37.0 |
| Stone Ridge: | 1.4 |
| Herndon: | 56.5 |
| South Riding: | 2.5 |
| Reston: | 15.5 |
 The median response time based on all reported fire incidents is 7 minutes. This is about the same as the Virginia median value.
The median response time in Leesburg, VA compared to nearest cities:
(Note: Based on data for all years, including only cities with at least 500 fire incidents)
| Leesburg: | 7 minutes |
| Ashburn: | 6 minutes |
| Purcellville: | 9 minutes |
| Sterling: | 6 minutes |
| Herndon: | 5 minutes |
| Brunswick: | 9 minutes |
| Reston: | 5 minutes |
| Germantown: | 6 minutes |
| Jefferson: | 9 minutes |
 Based on the data from the years 2002 - 2018 the average number of fire-related casualties per year is 0. The highest number of reported casualties - 2 took place in 2007, and the lowest - 0 in 2002. The data has a constant trend.
The average number of casualties per 1,000 fires is 1. This indicator was the highest - 9 in 2007, and the lowest 0 in 2002. The trend for casualties per 1,000 fire incidents is growing. Compared to the state value the number of casualties per 1,000 fires is much lower.
Based on the data from the years 2002 - 2018 the average number of fire-related casualties per year is 0. The highest number of reported casualties - 2 took place in 2007, and the lowest - 0 in 2002. The data has a constant trend.
The average number of casualties per 1,000 fires is 1. This indicator was the highest - 9 in 2007, and the lowest 0 in 2002. The trend for casualties per 1,000 fire incidents is growing. Compared to the state value the number of casualties per 1,000 fires is much lower.Casualties per 1,000 incidents in Leesburg, VA compared to nearest cities:
(Note: Based on data for all years, including only cities with at least 500 fire incidents)
| Leesburg: | 1.6 |
| Ashburn: | 4.0 |
| Purcellville: | 0.9 |
| Sterling: | 13.4 |
| Herndon: | 1.2 |
| Brunswick: | 0.0 |
| Reston: | 1.1 |
| Germantown: | 22.2 |
| Jefferson: | 1.6 |
 29.6% incidents where reported in the morning and 70.4% in the evening. The most fires (16.0%) took place on Thursday, and the least (12.7%) on Friday.
 According to the 2,510 fires from years 2002 - 2018 most fires (11.3%) took place during March, and the least (6.3%) in September.
 Out of all 15,038 cases reported during the years 2002 - 2018, the most belonged to the categories: Rescue & EMS (27.1%), Hazardous Condition (21.6%), and Good Intent Call (18.0%).
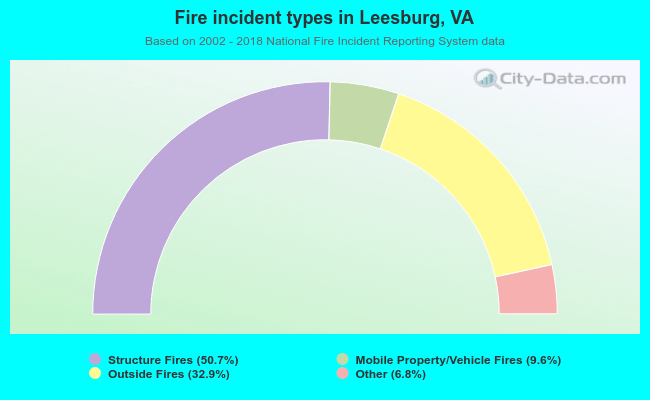 When looking into fire subcategories, the most incidents belonged to: Structure Fires (50.7%), and Outside Fires (32.9%).