Lompoc: Fire Incidents, California (CA)
Where are fire incidents reported in Lompoc, CA
Something went wrong! Please refresh the page.
| Fire incidents reported | |
|---|---|
| Sreet name | Count |
| H ST | 284 |
| L ST | 112 |
| NORTH AVE | 112 |
| OCEAN AVE | 112 |
| PINE AVE | 106 |
| G ST | 94 |
| COLLEGE AVE | 90 |
| A ST | 78 |
| K ST | 78 |
| O ST | 76 |
| M ST | 72 |
| D ST | 70 |
| E ST | 64 |
| F ST | 64 |
| HWY 1 | 62 |
| CHESTNUT AVE | 56 |
| LAUREL AVE | 56 |
| N ST | 56 |
| THIRD ST | 56 |
| FOURTH ST | 52 |
| I ST | 52 |
| CENTRAL AVE | 46 |
| V ST | 44 |
| HWY 246 | 42 |
| J ST | 42 |
| AIRPORT AVE | 38 |
| C ST | 38 |
| HARRIS GRADE RD | 38 |
| RIVERBED | 38 |
| B ST | 36 |
2005 - 2018 National Fire Incident Reporting System (NFIRS) incidents
- Incident types reported to NFIRS in Lompoc, CA
- 13,21059.5%Rescue & EMS
- 3,16414.2%Good Intent Call
- 2,1589.7%Fire
- 1,7267.8%Service Call
- 1,1845.3%Hazardous Condition
- 6993.1%False Alarm
- 650.3%Overpressure Rupture
- Fire incident types reported to NFIRS in Lompoc, CA
- 1,22756.9%Outside Fires
- 58827.2%Structure Fires
- 28813.3%Mobile Property/Vehicle Fires
- 552.5%Other
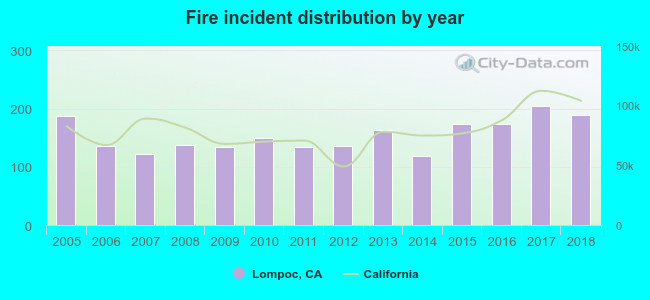 According to the data from the years 2005 - 2018 the average number of fire incidents per year is 154. The highest number of fires - 205 took place in 2017, and the least - 119 in 2014. The data has an increasing trend.
The average number of yearly fire incidents per 10k residents in Lompoc, CA compared to nearest cities:
(Note: Based on data for the last 3 years, including only cities with population 5,000 and above)
| Lompoc: | 43.0 |
| Buellton: | 52.2 |
| Orcutt: | 2.1 |
| Solvang: | 27.8 |
| Santa Maria: | 28.3 |
| Guadalupe: | 29.8 |
| Nipomo: | 18.1 |
| Oceano: | 3.7 |
| Arroyo Grande: | 3.5 |
 The median response time based on all reported fire incidents is 5 minutes. This is lower compared to the California median value.
The median response time in Lompoc, CA compared to nearest cities:
(Note: Based on data for all years, including only cities with at least 500 fire incidents)
| Lompoc: | 5 minutes |
| Mission Hills: | 5 minutes |
| Santa Maria: | 6 minutes |
| Isla Vista: | 6 minutes |
| Goleta: | 7 minutes |
| San Luis Obispo: | 6 minutes |
| Santa Barbara: | 5 minutes |
| Taft: | 6 minutes |
| Paso Robles: | 6 minutes |
 According to the reports from the years 2005 - 2018 the average number of fire-related yearly deaths is 0. The highest number of deaths - 1 took place in 2005, and the lowest - 0 in 2007. The data has a dropping trend.
 Based on the data from the years 2005 - 2018 the average number of fire-related casualties per year is 3. The highest number of injuries - 6 took place in 2005, and the lowest - 0 in 2008. The data has a decreasing trend.
The average number of casualties per 1,000 fires is 17. This indicator was the highest - 37 in 2011, and the lowest 0 in 2008. The trend for casualties per 1,000 fires is decreasing. Compared to the state value the number of casualties per 1,000 fires is much higher.
Based on the data from the years 2005 - 2018 the average number of fire-related casualties per year is 3. The highest number of injuries - 6 took place in 2005, and the lowest - 0 in 2008. The data has a decreasing trend.
The average number of casualties per 1,000 fires is 17. This indicator was the highest - 37 in 2011, and the lowest 0 in 2008. The trend for casualties per 1,000 fires is decreasing. Compared to the state value the number of casualties per 1,000 fires is much higher.Casualties per 1,000 incidents in Lompoc, CA compared to nearest cities:
(Note: Based on data for all years, including only cities with at least 500 fire incidents)
| Lompoc: | 17.6 |
| Mission Hills: | 10.3 |
| Santa Maria: | 3.8 |
| Isla Vista: | 1.8 |
| Goleta: | 5.2 |
| San Luis Obispo: | 4.3 |
| Santa Barbara: | 4.8 |
| Taft: | 7.1 |
| Paso Robles: | 0.0 |
 33.4% incidents where reported in the morning and 66.6% in the evening. The most fires (15.8%) took place on Sunday, and the least (12.7%) on Tuesday.
 Based on the 2,158 fire incidents from years 2005 - 2018 most fires (11.5%) took place during July, and the least (6.3%) in November.
 Out of all 22,215 cases reported during the years 2005 - 2018, the most belonged to the categories: Rescue & EMS (59.5%), Good Intent Call (14.2%), and Fire (9.7%).
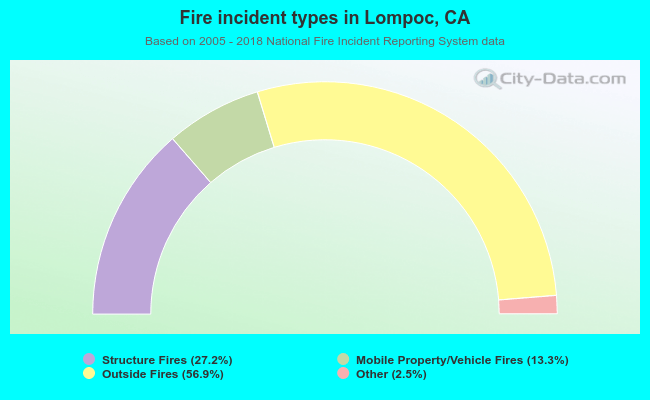 When looking into fire subcategories, the most incidents belonged to: Outside Fires (56.9%), and Structure Fires (27.2%).