Los Alamos: Fire Incidents, New Mexico (NM)
Where are fire incidents reported in Los Alamos, NM
Something went wrong! Please refresh the page.
|
| |||||||||||||||||||||||||||||||||||||||||||||||||||||||||||||||||||||||||||||||||||||||||||||||||||||||||||||
2005 - 2018 National Fire Incident Reporting System (NFIRS) incidents
- Incident types reported to NFIRS in Los Alamos, NM
- 4,43669.5%Rescue & EMS
- 5408.5%Hazardous Condition
- 4817.5%False Alarm
- 4076.4%Fire
- 2934.6%Service Call
- 2103.3%Good Intent Call
- 110.2%Special Incident
- Fire incident types reported to NFIRS in Los Alamos, NM
- 20550.4%Outside Fires
- 11327.8%Structure Fires
- 4811.8%Other
- 4110.1%Mobile Property/Vehicle Fires
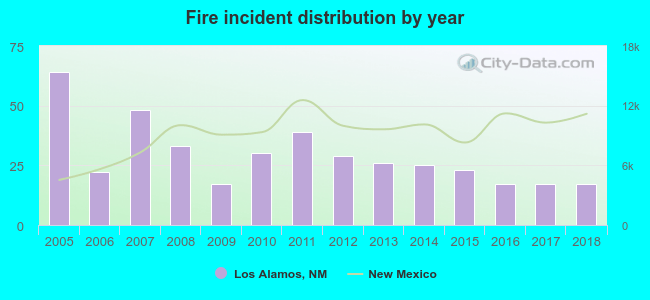 According to the data from the years 2005 - 2018 the average number of fire incidents per year is 29. The highest number of reported fire incidents - 64 took place in 2005, and the least - 17 in 2009. The data has a dropping trend.
The average number of yearly fire incidents per 10k residents in Los Alamos, NM compared to nearest cities:
(Note: Based on data for the last 3 years, including only cities with population 5,000 and above)
| Los Alamos: | 14.1 |
| White Rock: | 7.6 |
| Espanola: | 84.6 |
| San Juan Pueblo: | 1.5 |
| Santa Fe: | 24.3 |
| Eldorado at Santa Fe: | 21.2 |

 32.9% incidents where reported in the morning and 67.1% in the evening. The most fires (16.5%) took place on Sunday, and the least (11.8%) on Tuesday.
 According to the 407 incident reports from years 2005 - 2018 most fires (14.7%) took place during June, and the least (5.9%) in December.
 Out of all 6,385 cases reported during the years 2005 - 2018, the most belonged to the categories: Rescue & EMS (69.5%), Hazardous Condition (8.5%), and False Alarm (7.5%).
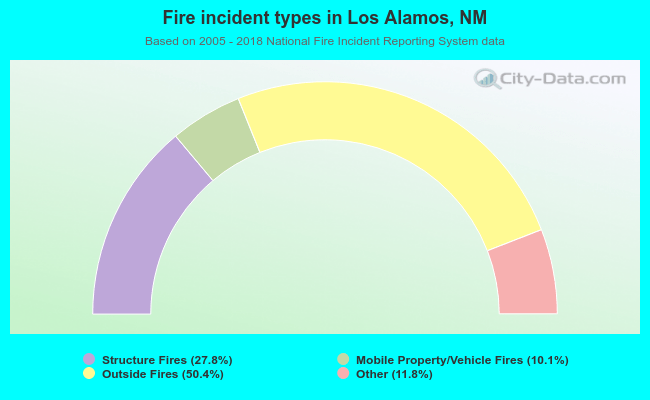 When looking into fire subcategories, the most incidents belonged to: Outside Fires (50.4%), and Structure Fires (27.8%).