Lynwood: Fire Incidents, California (CA)
Where are fire incidents reported in Lynwood, CA
Something went wrong! Please refresh the page.
| Fire incidents reported | |
|---|---|
| Sreet name | Count |
| IMPERIAL | 206 |
| LONG BEACH | 180 |
| ATLANTIC | 128 |
| MARTIN LUTHER KING JR | 110 |
| WRIGHT | 82 |
| ALAMEDA | 80 |
| STATE | 72 |
| CARLIN | 68 |
| LOUISE | 64 |
| NORTON | 60 |
| FERNWOOD | 52 |
| EL SEGUNDO | 50 |
| SANTA FE | 48 |
| CORTLAND | 46 |
| EUCLID | 44 |
| WB 105 EO LONG BEACH | 44 |
| BEECHWOOD | 42 |
| CALIFORNIA | 42 |
| NB 710 SO IMPERIAL | 42 |
| BULLIS | 40 |
| CEDAR | 38 |
| LOS FLORES | 38 |
| VIRGINIA | 38 |
| DUNCAN | 34 |
| JOSEPHINE | 32 |
| ABBOTT | 30 |
| NB 710 AT IMPERIAL | 28 |
| PLATT | 28 |
| AGNES | 24 |
| BIRCH | 24 |
2005 - 2018 National Fire Incident Reporting System (NFIRS) incidents
- Incident types reported to NFIRS in Lynwood, CA
- 17,46366.8%Rescue & EMS
- 4,73418.1%Good Intent Call
- 1,4575.6%Fire
- 1,1174.3%False Alarm
- 7793.0%Hazardous Condition
- 5802.2%Service Call
- Fire incident types reported to NFIRS in Lynwood, CA
- 62943.2%Outside Fires
- 42829.4%Mobile Property/Vehicle Fires
- 28019.2%Structure Fires
- 1208.2%Other
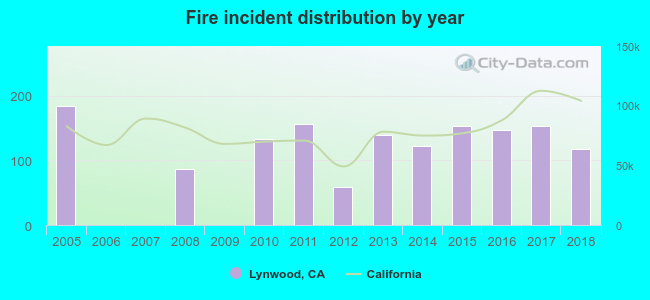 According to the data from the years 2005 - 2018 the average number of fire incidents per year is 104. The highest number of fires - 185 took place in 2005, and the least - 0 in 2006. The data has a dropping trend.
The average number of yearly fire incidents per 10k residents in Lynwood, CA compared to nearest cities:
(Note: Based on data for the last 3 years, including only cities with population 5,000 and above)
| Lynwood: | 19.4 |
| South Gate: | 15.8 |
| Compton: | 28.2 |
| Paramount: | 19.3 |
| Cudahy: | 13.6 |
| Walnut Park: | 11.5 |
| Bell: | 19.0 |
| Bell Gardens: | 18.3 |
| Huntington Park: | 19.9 |
 The median response time based on all reported fire incidents is 4 minutes. This is lower compared to the California median value.
The median response time in Lynwood, CA compared to nearest cities:
(Note: Based on data for all years, including only cities with at least 500 fire incidents)
| Lynwood: | 4 minutes |
| South Gate: | 5 minutes |
| Compton: | 6 minutes |
| Paramount: | 5 minutes |
| Bell: | 5 minutes |
| Bell Gardens: | 5 minutes |
| Huntington Park: | 4 minutes |
| Downey: | 7 minutes |
| Bellflower: | 4 minutes |
 36.7% incidents where reported in the morning and 63.3% in the evening. The most fires (16.2%) took place on Sunday, and the least (13.0%) on Wednesday.
 According to the 1,457 incident reports from years 2005 - 2018 most fires (15.6%) took place during January, and the least (6.2%) in September.
 Out of all 26,152 cases reported during the years 2005 - 2018, the most belonged to the categories: Rescue & EMS (66.8%), Good Intent Call (18.1%), and Fire (5.6%).
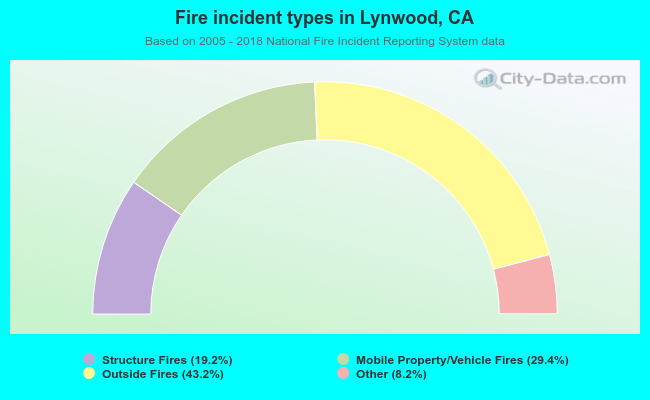 When looking into fire subcategories, the most reports belonged to: Outside Fires (43.2%), and Mobile Property/Vehicle Fires (29.4%).