Marlborough: Fire Incidents, Connecticut (CT)
Where are fire incidents reported in Marlborough, CT
Something went wrong! Please refresh the page.
|
| |||||||||||||||||||||||||||||||||||||||||||||||||||||||||||||||||||||||||||||||||||||||||||||||||||||||||||||
| Other | 2 | |||||||||||||||||||||||||||||||||||||||||||||||||||||||||||||||||||||||||||||||||||||||||||||||||||||||||||||
2002 - 2018 National Fire Incident Reporting System (NFIRS) incidents
- Incident types reported to NFIRS in Marlborough, CT
- 38327.5%Hazardous Condition
- 36726.3%Rescue & EMS
- 22816.3%Fire
- 15611.2%False Alarm
- 1299.2%Good Intent Call
- 1158.2%Service Call
- 60.4%Overpressure Rupture
- 60.4%Special Incident
- 50.4%Severe Weather
- Fire incident types reported to NFIRS in Marlborough, CT
- 10144.3%Structure Fires
- 6829.8%Outside Fires
- 4921.5%Mobile Property/Vehicle Fires
- 104.4%Other
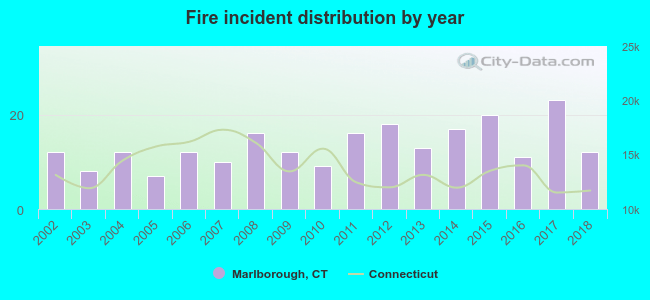 According to the data from the years 2002 - 2018 the average number of fires per year is 13. The highest number of reported fires - 23 took place in 2017, and the least - 7 in 2005. The data has a constant trend.
The average number of yearly fire incidents per 10k residents in Marlborough, CT compared to nearest cities:
(Note: Based on data for the last 3 years, including only cities with population 5,000 and above)
| Marlborough: | 23.9 |
| Hebron: | 17.2 |
| Glastonbury: | 19.0 |
| Colchester: | 31.3 |
| Portland: | 59.1 |
| Columbia: | 41.3 |
| East Haddam: | 25.2 |
| Manchester: | 29.6 |
| Rocky Hill: | 51.8 |

 29.4% incidents where reported in the morning and 70.6% in the evening. The most fires (20.2%) took place on Saturday, and the least (9.6%) on Wednesday.
 According to the 228 fires from years 2002 - 2018 most fires (12.7%) took place during January, and the least (2.2%) in September.
 Out of all 1,395 cases reported during the years 2002 - 2018, the most belonged to the categories: Hazardous Condition (27.5%), Rescue & EMS (26.3%), and Fire (16.3%).
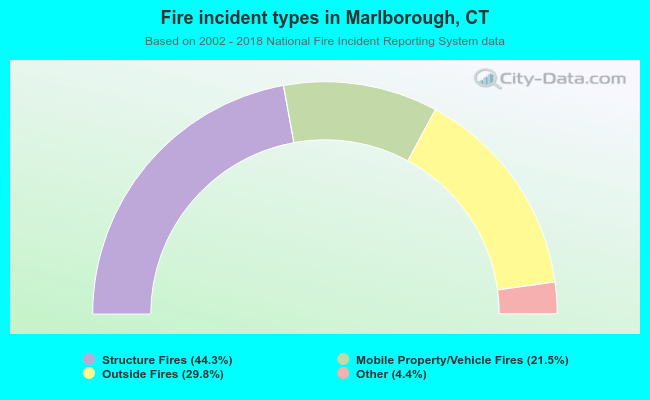 When looking into fire subcategories, the most incidents belonged to: Structure Fires (44.3%), and Outside Fires (29.8%).