Mentone: Fire Incidents, California (CA)
Where are fire incidents reported in Mentone, CA
Something went wrong! Please refresh the page.
|
| |||||||||||||||||||||||||||||||||||||||||||||||||||||||||||||||||||||||||||||||||||||||||||||||||||||||||||||
2005 - 2018 National Fire Incident Reporting System (NFIRS) incidents
- Incident types reported to NFIRS in Mentone, CA
- 1,17356.1%Rescue & EMS
- 40419.3%Good Intent Call
- 29214.0%Fire
- 984.7%Service Call
- 612.9%Hazardous Condition
- 512.4%False Alarm
- 120.6%Special Incident
- Fire incident types reported to NFIRS in Mentone, CA
- 14047.9%Outside Fires
- 10636.3%Structure Fires
- 3813.0%Mobile Property/Vehicle Fires
- 82.7%Other
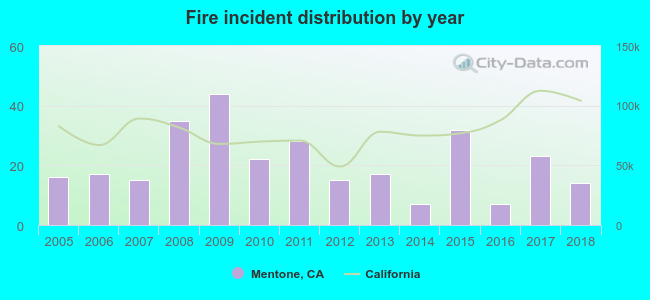 Based on the data from the years 2005 - 2018 the average number of fires per year is 21. The highest number of reported fires - 44 took place in 2009, and the least - 7 in 2014. The data has a declining trend.
The average number of yearly fire incidents per 10k residents in Mentone, CA compared to nearest cities:
(Note: Based on data for the last 3 years, including only cities with population 5,000 and above)
| Mentone: | 16.8 |
| Redlands: | 34.5 |
| Yucaipa: | 2.6 |
| Highland: | 2.4 |
| Calimesa: | 15.8 |
| Loma Linda: | 30.9 |
| Cherry Valley: | 6.3 |
| San Bernardino: | 22.7 |
| Moreno Valley: | 0.6 |

 28.8% incidents where reported in the morning and 71.2% in the evening. The most fires (22.6%) took place on Saturday, and the least (10.3%) on Wednesday.
 According to the 292 fire incidents from years 2005 - 2018 most fires (12.0%) took place during July, and the least (5.8%) in March.
 Out of all 2,091 cases reported during the years 2005 - 2018, the most belonged to the categories: Overpressure Rupture (56.1%), Service Call (19.3%), and Fire (14.0%).
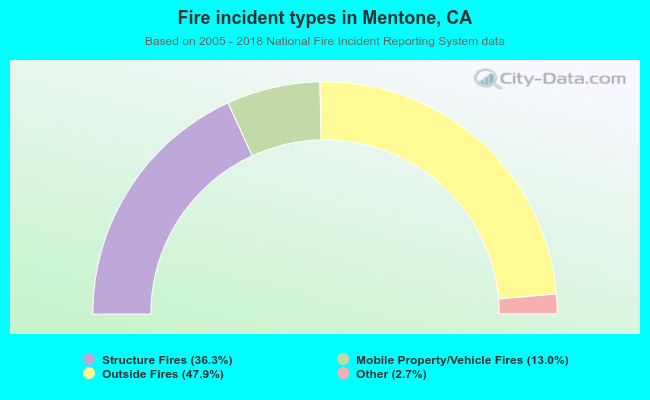 When looking into fire subcategories, the most incidents belonged to: Outside Fires (47.9%), and Structure Fires (36.3%).