Middleton: Fire Incidents, Wisconsin (WI)
Where are fire incidents reported in Middleton, WI
Something went wrong! Please refresh the page.
|
| |||||||||||||||||||||||||||||||||||||||||||||||||||||||||||||||||||||||||||||||||||||||||||||||||||||||||||||
2002 - 2018 National Fire Incident Reporting System (NFIRS) incidents
- Incident types reported to NFIRS in Middleton, WI
- 99924.0%False Alarm
- 86320.7%Hazardous Condition
- 79319.0%Rescue & EMS
- 66816.0%Fire
- 59514.3%Good Intent Call
- 2155.2%Service Call
- 180.4%Severe Weather
- 100.2%Overpressure Rupture
- Fire incident types reported to NFIRS in Middleton, WI
- 32348.4%Structure Fires
- 23735.5%Outside Fires
- 8412.6%Mobile Property/Vehicle Fires
- 243.6%Other
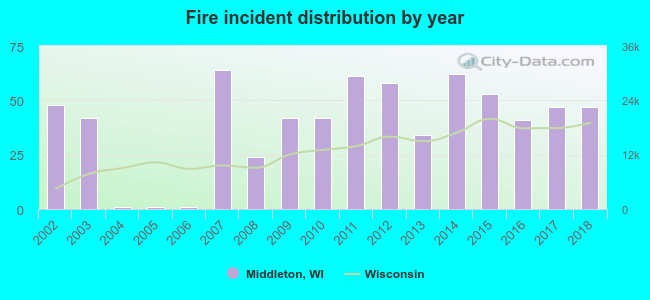 Based on the data from the years 2002 - 2018 the average number of fires per year is 39. The highest number of fire incidents - 64 took place in 2007, and the least - 1 in 2004. The data has a declining trend.
The average number of yearly fire incidents per 10k residents in Middleton, WI compared to nearest cities:
(Note: Based on data for the last 3 years, including only cities with population 5,000 and above)
| Middleton: | 24.1 |
| Madison: | 8.6 |
| Waunakee: | 17.1 |
| Fitchburg: | 33.1 |
| Verona: | 27.8 |
| Monona: | 25.4 |
| McFarland: | 33.0 |
| DeForest: | 5.3 |
| Mount Horeb: | 17.6 |
 The median response time based on all reported fire incidents is 6 minutes. This is similar to the state median value.
The median response time in Middleton, WI compared to nearest cities:
(Note: Based on data for all years, including only cities with at least 500 fire incidents)
| Middleton: | 6 minutes |
| Madison: | 6 minutes |
| Fitchburg: | 7 minutes |
| Sun Prairie: | 8 minutes |
| Baraboo: | 7 minutes |
| Edgerton: | 10 minutes |
 31.6% incidents where reported in the morning and 68.4% in the evening. The most fires (16.6%) took place on Sunday, and the least (12.9%) on Wednesday.
 According to the 668 incident reports from years 2002 - 2018 most fires (12.1%) took place during April, and the least (4.5%) in September.
 Out of all 4,165 cases reported during the years 2002 - 2018, the most belonged to the categories: False Alarm (24.0%), Hazardous Condition (20.7%), and Rescue & EMS (19.0%).
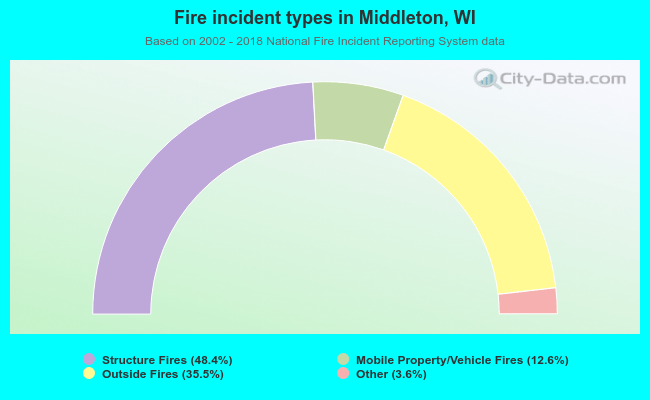 When looking into fire subcategories, the most reports belonged to: Structure Fires (48.4%), and Outside Fires (35.5%).