Morgan City: Fire Incidents, Louisiana (LA)
Where are fire incidents reported in Morgan City, LA
Something went wrong! Please refresh the page.
|
| |||||||||||||||||||||||||||||||||||||||||||||||||||||||||||||||||||||||||||||||||||||||||||||||||||||||||||||
2002 - 2018 National Fire Incident Reporting System (NFIRS) incidents
- Incident types reported to NFIRS in Morgan City, LA
- 56237.7%Hazardous Condition
- 35924.1%Rescue & EMS
- 34723.3%Fire
- 835.6%False Alarm
- 644.3%Service Call
- 604.0%Good Intent Call
- 80.5%Special Incident
- 50.3%Overpressure Rupture
- Fire incident types reported to NFIRS in Morgan City, LA
- 14742.4%Structure Fires
- 11232.3%Outside Fires
- 6619.0%Mobile Property/Vehicle Fires
- 226.3%Other
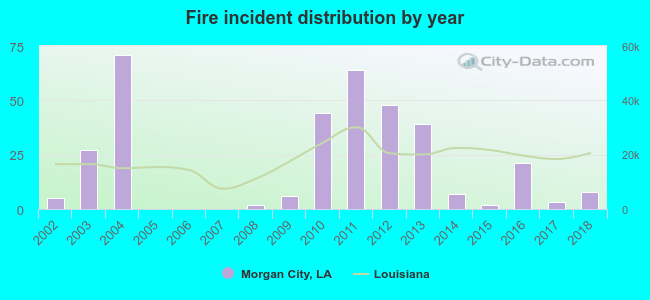 Based on the data from the years 2002 - 2018 the average number of fires per year is 20. The highest number of reported fires - 71 took place in 2004, and the least - 0 in 2005. The data has an increasing trend.
The average number of yearly fire incidents per 10k residents in Morgan City, LA compared to nearest cities:
(Note: Based on data for the last 3 years, including only cities with population 5,000 and above)
| Morgan City: | 8.9 |
| Patterson: | 18.0 |
| Franklin: | 76.9 |
| Schriever: | 20.9 |
| Central: | 0.7 |
| Thibodaux: | 55.5 |
| Gray: | 16.1 |
| Houma: | 70.9 |
| Donaldsonville: | 74.7 |

 30.5% incidents where reported in the morning and 69.5% in the evening. The most fires (17.9%) took place on Saturday, and the least (11.2%) on Friday.
 Based on the 347 fire incident reports from years 2002 - 2018 most fires (12.4%) took place during April, and the least (5.2%) in August.
 Out of all 1,489 cases reported during the years 2002 - 2018, the most belonged to the categories: Hazardous Condition (37.7%), Rescue & EMS (24.1%), and Fire (23.3%).
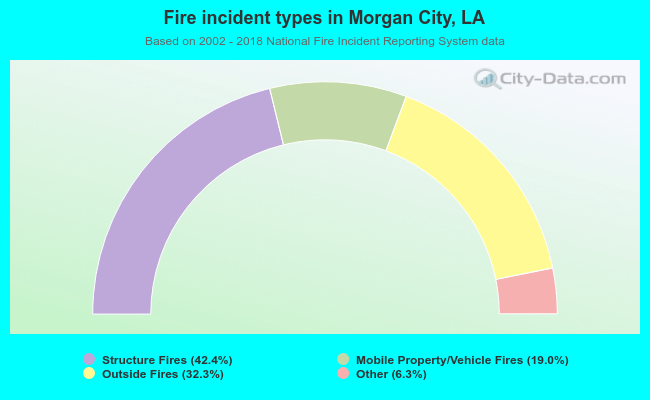 When looking into fire subcategories, the most reports belonged to: Structure Fires (42.4%), and Outside Fires (32.3%).