New London: Fire Incidents, Connecticut (CT)
Where are fire incidents reported in New London, CT
Something went wrong! Please refresh the page.
| Fire incidents reported | |
|---|---|
| Sreet name | Count |
| COLMAN ST | 274 |
| BANK ST | 236 |
| BROAD ST | 234 |
| HUNTINGTON ST | 210 |
| MONTAUK AVE | 190 |
| HAWTHORNE DR | 176 |
| OCEAN AVE | 170 |
| CRYSTAL AVE | 122 |
| PEQUOT AVE | 118 |
| MICHAEL RD | 114 |
| STATE ST | 112 |
| JEFFERSON AVE | 110 |
| WILLIAMS ST | 108 |
| STATE PIER RD | 106 |
| FRONTAGE RD | 102 |
| CONNECTICUT AVE | 90 |
| HEMPSTEAD ST | 88 |
| CHESTER ST | 86 |
| NAUTILUS DR | 84 |
| JAY ST | 76 |
| VAUXHALL ST | 74 |
| FEDERAL ST | 68 |
| MOHEGAN AVE | 68 |
| COIT ST | 58 |
| SHAW ST | 58 |
| WILLETTS AVE | 58 |
| SHAWS COVE | 50 |
| GARFIELD AVE | 46 |
| CEDAR GROVE AVE | 44 |
| EUGENE O'NEILL DR | 42 |
2002 - 2018 National Fire Incident Reporting System (NFIRS) incidents
- Incident types reported to NFIRS in New London, CT
- 27,43070.5%Rescue & EMS
- 3,8009.8%Hazardous Condition
- 2,7717.1%Fire
- 2,1435.5%False Alarm
- 1,3503.5%Good Intent Call
- 1,3133.4%Service Call
- 450.1%Overpressure Rupture
- Fire incident types reported to NFIRS in New London, CT
- 1,53355.3%Structure Fires
- 84030.3%Outside Fires
- 35712.9%Mobile Property/Vehicle Fires
- 411.5%Other
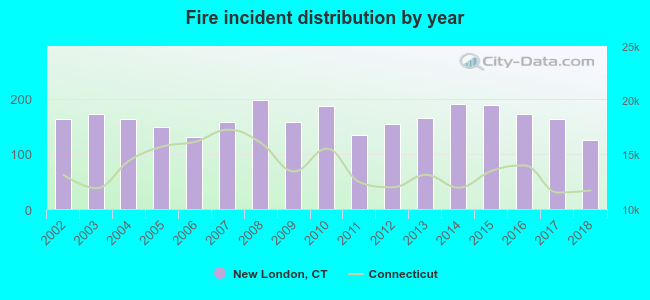 Based on the data from the years 2002 - 2018 the average number of fires per year is 163. The highest number of fires - 197 took place in 2008, and the least - 125 in 2018. The data has a decreasing trend.
The average number of yearly fire incidents per 10k residents in New London, CT compared to nearest cities:
(Note: Based on data for the last 3 years, including only cities with population 5,000 and above)
| New London: | 56.0 |
| Groton: | 75.6 |
| Waterford: | 24.3 |
| East Lyme: | 20.4 |
| Ledyard: | 22.6 |
| Montville: | 19.2 |
| Old Lyme: | 9.2 |
| Norwich: | 38.9 |
| North Stonington: | 49.1 |
 The median response time based on all reported fire incidents is 4 minutes. This is lower compared to the Connecticut median value.
The median response time in New London, CT compared to nearest cities:
(Note: Based on data for all years, including only cities with at least 500 fire incidents)
| New London: | 4 minutes |
| Groton: | 4 minutes |
| Waterford: | 6 minutes |
| East Lyme: | 6 minutes |
| Mystic: | 5 minutes |
| Ledyard: | 9 minutes |
| Montville: | 7 minutes |
| Preston: | 8 minutes |
| Norwich: | 4 minutes |
 Based on the reports from the years 2002 - 2018 the average number of fire-related yearly deaths is 0. The highest number of reported deaths - 2 took place in 2002, and the lowest - 0 in 2003. The data has a decreasing trend.
The average number of fatalities per 1,000 fires is 2. This indicator was the highest - 13 in 2012, and the lowest 0 in 2003. The trend for deaths per 1,000 incidents is declining. Compared to the Connecticut value the number of deaths per 1,000 fire incidents is higher.
Based on the reports from the years 2002 - 2018 the average number of fire-related yearly deaths is 0. The highest number of reported deaths - 2 took place in 2002, and the lowest - 0 in 2003. The data has a decreasing trend.
The average number of fatalities per 1,000 fires is 2. This indicator was the highest - 13 in 2012, and the lowest 0 in 2003. The trend for deaths per 1,000 incidents is declining. Compared to the Connecticut value the number of deaths per 1,000 fire incidents is higher.Deaths per 1,000 incidents in New London, CT compared to nearest cities:
(Note: Based on data for all years, including only cities with at least 2,500 fire incidents)
| New London: | 2.2 |
| Norwich: | 1.0 |
 Based on the data from the years 2002 - 2018 the average number of fire-related yearly casualties is 6. The highest number of reported casualties - 13 took place in 2009, and the lowest - 1 in 2017. The data has a rising trend.
The average number of casualties per 1,000 fire incidents is 34. This indicator was the highest - 82 in 2009, and the lowest 6 in 2017. The trend for casualties per 1,000 fires is growing. Compared to the Connecticut value the number of casualties per 1,000 fires is much higher.
Based on the data from the years 2002 - 2018 the average number of fire-related yearly casualties is 6. The highest number of reported casualties - 13 took place in 2009, and the lowest - 1 in 2017. The data has a rising trend.
The average number of casualties per 1,000 fire incidents is 34. This indicator was the highest - 82 in 2009, and the lowest 6 in 2017. The trend for casualties per 1,000 fires is growing. Compared to the Connecticut value the number of casualties per 1,000 fires is much higher.
 30.4% incidents where reported in the morning and 69.6% in the evening. The most fires (15.2%) took place on Monday, and the least (13.9%) on Thursday.
 Based on the 2,771 incident reports from years 2002 - 2018 most fires (10.9%) took place during April, and the least (6.9%) in September.
 Out of all 38,888 cases reported during the years 2002 - 2018, the most belonged to the categories: Rescue & EMS (70.5%), Hazardous Condition (9.8%), and Fire (7.1%).
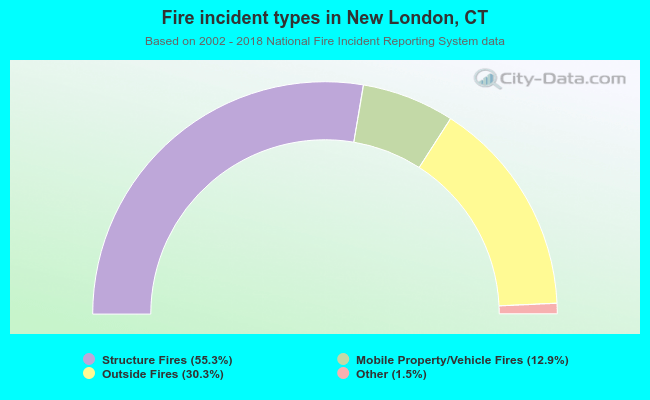 When looking into fire subcategories, the most incidents belonged to: Structure Fires (55.3%), and Outside Fires (30.3%).