Newport: Fire Incidents, Tennessee (TN)
Where are fire incidents reported in Newport, TN
Something went wrong! Please refresh the page.
| Fire incidents reported | |
|---|---|
| Sreet name | Count |
| COSBY HWY | 74 |
| I-40 | 64 |
| HOLT TOWN RD | 54 |
| 160 HWY | 48 |
| BROADWAY | 44 |
| INDUSTRIAL RD | 42 |
| 2570 HWY | 38 |
| 25/70 HWY | 36 |
| I40 | 36 |
| EDWINA BRIDGEPORT RD | 32 |
| CARSON SPRINGS RD | 28 |
| CHEMWOOD DR | 22 |
| GOLF COURSE RD | 22 |
| 25/70 | 20 |
| BROADWAY BLVD | 20 |
| HILL RD | 20 |
| INTERSTATE 40 | 20 |
| RIVER ST | 20 |
| COSBY HIGHWAY | 18 |
| EPLEY RD | 18 |
| LOWER ENGLISH CREEK RD | 18 |
| POINT PLEASANT RD | 18 |
| 2570 | 16 |
| ARMORY RD | 16 |
| BANJO WAY | 16 |
| INDUSTRIAL ROAD | 16 |
| LOWER ENGLISH CREEK ROAD | 16 |
| NORTH ST | 16 |
| ROCK CITY RD | 16 |
| WOODLAWN AVE | 16 |
| Other | 1,535 |
2002 - 2018 National Fire Incident Reporting System (NFIRS) incidents
- Incident types reported to NFIRS in Newport, TN
- 2,37535.2%Fire
- 1,56723.2%Hazardous Condition
- 1,10116.3%Rescue & EMS
- 72010.7%Good Intent Call
- 5047.5%False Alarm
- 4246.3%Service Call
- 270.4%Special Incident
- 160.2%Severe Weather
- 80.1%Overpressure Rupture
- Fire incident types reported to NFIRS in Newport, TN
- 91438.5%Structure Fires
- 82834.9%Outside Fires
- 52722.2%Mobile Property/Vehicle Fires
- 1064.5%Other
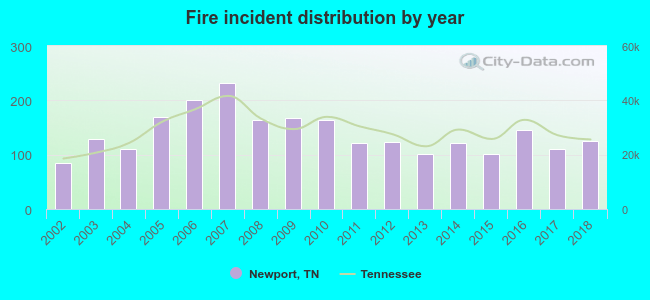 Based on the data from the years 2002 - 2018 the average number of fires per year is 140. The highest number of reported fires - 232 took place in 2007, and the least - 85 in 2002. The data has an increasing trend.
The average number of yearly fire incidents per 10k residents in Newport, TN compared to nearest cities:
(Note: Based on data for the last 3 years, including only cities with population 5,000 and above)
| Newport: | 185.1 |
| Morristown: | 46.5 |
| Jefferson City: | 55.4 |
| Sevierville: | 183.4 |
| Pigeon Forge: | 125.0 |
| Strawberry Plains: | 29.7 |
| Greeneville: | 133.0 |
| Bean Station: | 20.9 |
| Seymour: | 67.2 |
 The median response time based on all reported fire incidents is 7 minutes. This is similar to the state median value.
The median response time in Newport, TN compared to nearest cities:
(Note: Based on data for all years, including only cities with at least 500 fire incidents)
| Newport: | 7 minutes |
| Parrottsville: | 12 minutes |
| Dandridge: | 10 minutes |
| Morristown: | 5 minutes |
| Jefferson City: | 5 minutes |
| Mosheim: | 9 minutes |
| Sevierville: | 13 minutes |
| New Market: | 6 minutes |
| Pigeon Forge: | 8 minutes |
 According to the data from the years 2002 - 2018 the average number of fire-related fatalities per year is 0. The highest number of reported deaths - 1 took place in 2005, and the lowest - 0 in 2002. The data has a constant trend.
 34.8% incidents where reported in the morning and 65.2% in the evening. The most fires (15.4%) took place on Tuesday, and the least (12.7%) on Sunday.
 Based on the 2,375 fire incident reports from years 2002 - 2018 most fires (11.2%) took place during March, and the least (6.3%) in August.
 Out of all 6,742 cases reported during the years 2002 - 2018, the most belonged to the categories: Fire (35.2%), Hazardous Condition (23.2%), and Rescue & EMS (16.3%).
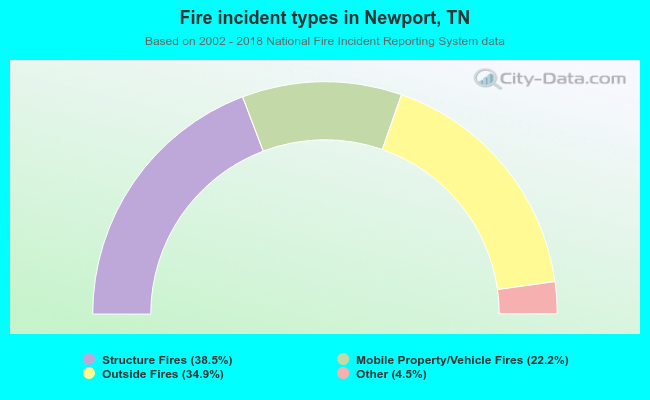 When looking into fire subcategories, the most incidents belonged to: Structure Fires (38.5%), and Outside Fires (34.9%).