Niles: Fire Incidents, Ohio (OH)
Where are fire incidents reported in Niles, OH
Something went wrong! Please refresh the page.
| Fire incidents reported | |
|---|---|
| Sreet name | Count |
| WARREN AVE | 78 |
| YOUNGSTOWN WARREN RD | 74 |
| MAIN ST | 72 |
| ROBBINS AVE | 72 |
| YOUNGSTOWN-WARREN RD | 70 |
| SENECA ST | 58 |
| PARK AVE | 46 |
| NORTH RD | 44 |
| SALT SPRINGS RD | 24 |
| MASON ST | 22 |
| WEST PARK AVE | 22 |
| ROYAL MALL DR | 20 |
| CEDAR ST | 16 |
| STATE ST | 16 |
| BELMONT AVE | 14 |
| FIRST ST | 14 |
| FULTON AVE | 14 |
| SUMMIT AVE | 14 |
| BALDWIN AVE | 12 |
| DAKOTA AVE | 12 |
| HYDE AVE | 12 |
| INDIANA AVE | 12 |
| MALL BLVD | 12 |
| ROYAL MALL | 12 |
| SMITH ST | 12 |
| 9TH ST | 10 |
| ANN ST | 10 |
| FIFTH ST | 10 |
| LAFAYETTE AVE | 10 |
| MAHONING AVE | 10 |
| Other | 235 |
2002 - 2018 National Fire Incident Reporting System (NFIRS) incidents
- Incident types reported to NFIRS in Niles, OH
- 6,00156.6%Rescue & EMS
- 1,13310.7%Service Call
- 1,05910.0%Fire
- 8528.0%Good Intent Call
- 8347.9%Hazardous Condition
- 6346.0%False Alarm
- 530.5%Special Incident
- 220.2%Overpressure Rupture
- 180.2%Severe Weather
- Fire incident types reported to NFIRS in Niles, OH
- 48946.2%Outside Fires
- 42139.8%Structure Fires
- 13813.0%Mobile Property/Vehicle Fires
- 111.0%Other
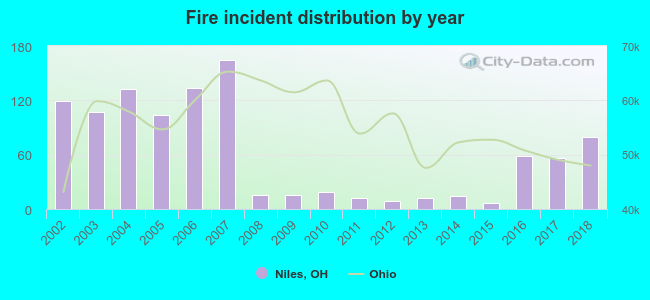 Based on the data from the years 2002 - 2018 the average number of fire incidents per year is 62. The highest number of fires - 164 took place in 2007, and the least - 7 in 2015. The data has a dropping trend.
The average number of yearly fire incidents per 10k residents in Niles, OH compared to nearest cities:
(Note: Based on data for the last 3 years, including only cities with population 5,000 and above)
| Niles: | 34.4 |
| Girard: | 36.9 |
| Warren: | 91.9 |
| Austintown: | 36.3 |
| Youngstown: | 89.8 |
| Hubbard: | 84.0 |
| Cortland: | 120.2 |
| Canfield: | 35.6 |
| Boardman: | 20.4 |
 The median response time based on all reported fire incidents is 4 minutes. This is lower compared to the state median value.
The median response time in Niles, OH compared to nearest cities:
(Note: Based on data for all years, including only cities with at least 500 fire incidents)
| Niles: | 4 minutes |
| Girard: | 4 minutes |
| Warren: | 5 minutes |
| Austintown: | 5 minutes |
| Leavittsburg: | 8 minutes |
| Youngstown: | 3 minutes |
| Hubbard: | 8 minutes |
| Cortland: | 8 minutes |
| Canfield: | 6 minutes |
 Based on the reports from the years 2002 - 2018 the average number of fire-related casualties per year is 1. The highest number of reported injuries - 5 took place in 2002, and the lowest - 0 in 2003. The data has a decreasing trend.
The average number of casualties per 1,000 fire incidents is 11. This indicator was the highest - 69 in 2016, and the lowest 0 in 2003. The trend for injuries per 1,000 fire incidents is declining. Compared to the state value the number of injuries per 1,000 fire incidents is about the same.
Based on the reports from the years 2002 - 2018 the average number of fire-related casualties per year is 1. The highest number of reported injuries - 5 took place in 2002, and the lowest - 0 in 2003. The data has a decreasing trend.
The average number of casualties per 1,000 fire incidents is 11. This indicator was the highest - 69 in 2016, and the lowest 0 in 2003. The trend for injuries per 1,000 fire incidents is declining. Compared to the state value the number of injuries per 1,000 fire incidents is about the same.Casualties per 1,000 incidents in Niles, OH compared to nearest cities:
(Note: Based on data for all years, including only cities with at least 500 fire incidents)
| Niles: | 17.0 |
| Girard: | 5.8 |
| Warren: | 22.5 |
| Austintown: | 40.8 |
| Leavittsburg: | 16.4 |
| Youngstown: | 11.1 |
| Hubbard: | 2.3 |
| Cortland: | 17.5 |
| Canfield: | 38.0 |
 28.9% incidents where reported in the morning and 71.1% in the evening. The most fires (15.8%) took place on Saturday, and the least (13.1%) on Wednesday.
 Based on the 1,059 fire incident reports from years 2002 - 2018 most fires (12.7%) took place during April, and the least (4.6%) in January.
 Out of all 10,606 cases reported during the years 2002 - 2018, the most belonged to the categories: Rescue & EMS (56.6%), Service Call (10.7%), and Fire (10.0%).
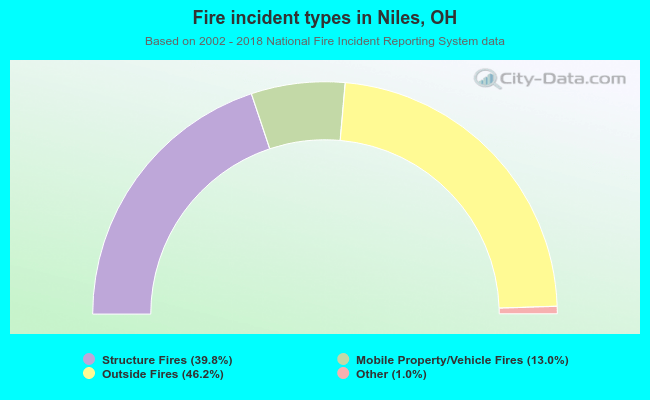 When looking into fire subcategories, the most incidents belonged to: Outside Fires (46.2%), and Structure Fires (39.8%).