North Royalton: Fire Incidents, Ohio (OH)
Where are fire incidents reported in North Royalton, OH
Something went wrong! Please refresh the page.
| Fire incidents reported | |
|---|---|
| Sreet name | Count |
| ROYALTON RD | 170 |
| RIDGE RD | 154 |
| STATE RD | 96 |
| YORK RD | 80 |
| AKINS RD | 64 |
| BENNETT RD | 60 |
| WALLINGS RD | 44 |
| OAKBROOK DR | 36 |
| WEST 130TH ST | 36 |
| ALBION RD | 34 |
| EDGERTON RD | 34 |
| SPRAGUE RD | 34 |
| HARBOUR LIGHT DR | 30 |
| ROYALWOOD RD | 28 |
| ABBEY RD | 26 |
| ALEXANDRA DR | 26 |
| GLENMONT DR | 26 |
| SPRUCE RUN DR | 24 |
| COVE DR | 20 |
| HAMPTON CLUB DR | 20 |
| SUNRISE BLVD | 20 |
| SATURN DR | 18 |
| AKINS | 16 |
| PINE FOREST DR | 16 |
| WILTSHIRE RD | 16 |
| DOULA LN | 14 |
| SOMERSET DR | 14 |
| TILBY RD | 14 |
| BOSTON RD | 12 |
| BUNKER RD | 12 |
2002 - 2018 National Fire Incident Reporting System (NFIRS) incidents
- Incident types reported to NFIRS in North Royalton, OH
- 11,70061.8%Rescue & EMS
- 2,65914.0%Service Call
- 1,8459.7%Hazardous Condition
- 1,0045.3%Fire
- 8334.4%Good Intent Call
- 7744.1%False Alarm
- 890.5%Special Incident
- 290.2%Severe Weather
- Fire incident types reported to NFIRS in North Royalton, OH
- 59859.6%Structure Fires
- 27227.1%Outside Fires
- 11811.8%Mobile Property/Vehicle Fires
- 161.6%Other
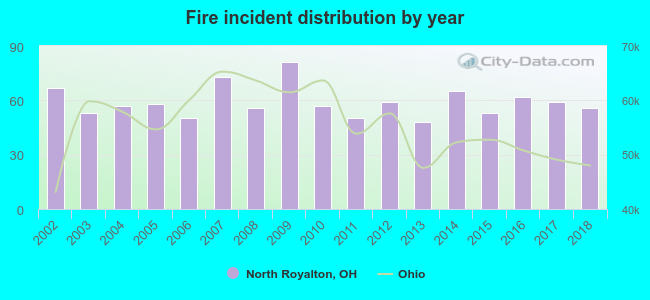 According to the data from the years 2002 - 2018 the average number of fires per year is 59. The highest number of reported fires - 81 took place in 2009, and the least - 48 in 2013. The data has a declining trend.
The average number of yearly fire incidents per 10k residents in North Royalton, OH compared to nearest cities:
(Note: Based on data for the last 3 years, including only cities with population 5,000 and above)
| North Royalton: | 19.5 |
| Broadview Heights: | 15.9 |
| Middleburg Heights: | 26.2 |
| Strongsville: | 22.2 |
| Parma Heights: | 23.9 |
| Parma: | 21.2 |
| Seven Hills: | 23.6 |
| Brecksville: | 32.7 |
| Brook Park: | 25.1 |
 The median response time based on all reported fire incidents is 5 minutes. This is lower compared to the Ohio median value.
The median response time in North Royalton, OH compared to nearest cities:
(Note: Based on data for all years, including only cities with at least 500 fire incidents)
| North Royalton: | 5 minutes |
| Strongsville: | 6 minutes |
| Parma Heights: | 3 minutes |
| Parma: | 4 minutes |
| Brecksville: | 6 minutes |
| Brook Park: | 5 minutes |
| Independence: | 6 minutes |
| Berea: | 5 minutes |
| Brunswick: | 6 minutes |
 According to the reports from the years 2002 - 2018 the average number of fire-related yearly casualties is 1. The highest number of casualties - 2 took place in 2006, and the lowest - 0 in 2003. The data has a decreasing trend.
The average number of casualties per 1,000 fires is 11. This indicator was the highest - 42 in 2013, and the lowest 0 in 2003. The trend for casualties per 1,000 fire incidents is dropping. Compared to the Ohio value the number of injuries per 1,000 fire incidents is lower.
According to the reports from the years 2002 - 2018 the average number of fire-related yearly casualties is 1. The highest number of casualties - 2 took place in 2006, and the lowest - 0 in 2003. The data has a decreasing trend.
The average number of casualties per 1,000 fires is 11. This indicator was the highest - 42 in 2013, and the lowest 0 in 2003. The trend for casualties per 1,000 fire incidents is dropping. Compared to the Ohio value the number of injuries per 1,000 fire incidents is lower.Casualties per 1,000 incidents in North Royalton, OH compared to nearest cities:
(Note: Based on data for all years, including only cities with at least 500 fire incidents)
| North Royalton: | 11.0 |
| Strongsville: | 9.1 |
| Parma Heights: | 43.3 |
| Parma: | 19.1 |
| Brecksville: | 0.0 |
| Brook Park: | 25.0 |
| Independence: | 8.2 |
| Berea: | 15.4 |
| Brunswick: | 12.6 |
 33.0% incidents where reported in the morning and 67.0% in the evening. The most fires (16.0%) took place on Sunday, and the least (11.7%) on Saturday.
 According to the 1,004 fires from years 2002 - 2018 most fires (11.2%) took place during July, and the least (5.4%) in February.
 Out of all 18,946 cases reported during the years 2002 - 2018, the most belonged to the categories: Rescue & EMS (61.8%), Service Call (14.0%), and Hazardous Condition (9.7%).
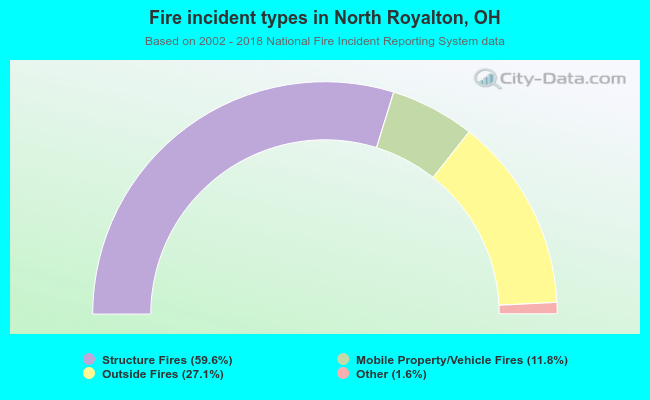 When looking into fire subcategories, the most reports belonged to: Structure Fires (59.6%), and Outside Fires (27.1%).