Oakmont: Fire Incidents, Pennsylvania (PA)
Where are fire incidents reported in Oakmont, PA
Something went wrong! Please refresh the page.
|
| |||||||||||||||||||||||||||||||||||||||||||||||||||||||||||||||||||||||||||||||||||||||||||||||||||||||||||||
2004 - 2018 National Fire Incident Reporting System (NFIRS) incidents
- Incident types reported to NFIRS in Oakmont, PA
- 22327.7%False Alarm
- 17922.2%Hazardous Condition
- 10813.4%Fire
- 10713.3%Service Call
- 10112.5%Good Intent Call
- 779.6%Rescue & EMS
- 81.0%Severe Weather
- 10.1%Overpressure Rupture
- 10.1%Special Incident
- Fire incident types reported to NFIRS in Oakmont, PA
- 6560.2%Structure Fires
- 1816.7%Other
- 1413.0%Outside Fires
- 1110.2%Mobile Property/Vehicle Fires
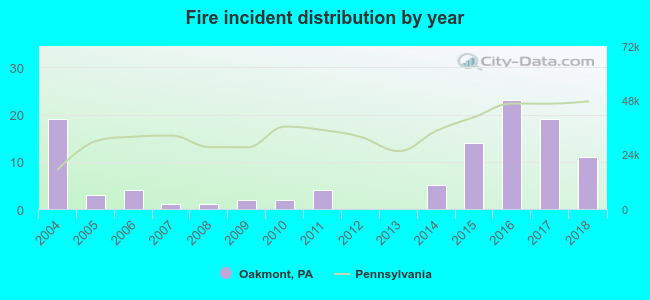 According to the data from the years 2004 - 2018 the average number of fire incidents per year is 7. The highest number of fire incidents - 23 took place in 2016, and the least - 0 in 2012. The data has a dropping trend.
The average number of yearly fire incidents per 10k residents in Oakmont, PA compared to nearest cities:
(Note: Based on data for the last 3 years, including only cities with population 5,000 and above)
| Oakmont: | 27.5 |
| Fox Chapel: | 10.5 |
| Penn Hills: | 18.7 |
| Plum: | 29.4 |
| New Kensington: | 29.2 |
| Arnold: | 10.0 |
| Wilkinsburg: | 31.6 |
| Forest Hills: | 31.9 |
| Glenshaw: | 2.6 |

 35.2% incidents where reported in the morning and 64.8% in the evening. The most fires (18.5%) took place on Saturday, and the least (11.1%) on Monday.
 According to the 108 fire incident reports from years 2004 - 2018 most fires (17.6%) took place during May, and the least (2.8%) in March.
 Out of all 805 cases reported during the years 2004 - 2018, the most belonged to the categories: False Alarm (27.7%), Hazardous Condition (22.2%), and Fire (13.4%).
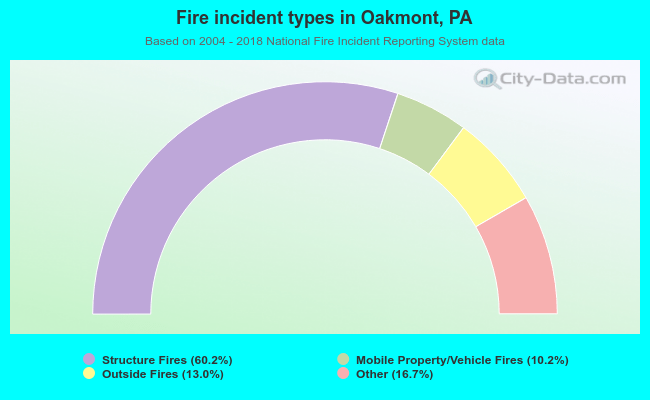 When looking into fire subcategories, the most reports belonged to: Structure Fires (60.2%), and Other (16.7%).