Pflugerville: Fire Incidents, Texas (TX)
Where are fire incidents reported in Pflugerville, TX
Something went wrong! Please refresh the page.
| Fire incidents reported | |
|---|---|
| Sreet name | Count |
| HEATHERWILDE BLVD | 186 |
| PECAN ST | 136 |
| IH 35 | 128 |
| CAMERON RD | 106 |
| DESSAU RD | 82 |
| FM 685 | 70 |
| KILLINGSWORTH LA | 58 |
| FOOTHILL FARMS LOOP | 46 |
| WELLS BRANCH PKWY | 46 |
| FM 685 RD | 42 |
| BROKEN FEATHER TRL | 40 |
| PFLUGERVILLE PKWY | 40 |
| RAILROAD AVE | 40 |
| GRAND AVENUE PKWY | 38 |
| HOWARD LA | 38 |
| HOWARD LN | 38 |
| SH130 HWY | 36 |
| DEWBERRY DR | 32 |
| FM 973 | 30 |
| PICADILLY DR | 30 |
| WELLS BRANCH PKWY | 30 |
| SWENSON FARMS BLVD | 26 |
| IMMANUEL RD | 24 |
| PFLUGERVILLE PKY | 24 |
| WEISS LA | 24 |
| GREGG LN | 22 |
| LAZYRIDGE DR | 22 |
| NIGHTVIEW DR | 22 |
| PIGEON FORGE RD | 22 |
| WINDERMERE DR | 22 |
| Other | 890 |
2003 - 2018 National Fire Incident Reporting System (NFIRS) incidents
- Incident types reported to NFIRS in Pflugerville, TX
- 14,55060.6%Rescue & EMS
- 2,3909.9%Fire
- 2,2349.3%Good Intent Call
- 2,0168.4%Hazardous Condition
- 1,5006.2%False Alarm
- 1,2815.3%Service Call
- 380.2%Special Incident
- Fire incident types reported to NFIRS in Pflugerville, TX
- 1,22251.1%Outside Fires
- 67028.0%Structure Fires
- 36115.1%Mobile Property/Vehicle Fires
- 1375.7%Other
 Based on the data from the years 2003 - 2018 the average number of fire incidents per year is 149. The highest number of reported fires - 210 took place in 2013, and the least - 103 in 2017. The data has a dropping trend.
The average number of yearly fire incidents per 10k residents in Pflugerville, TX compared to nearest cities:
(Note: Based on data for the last 3 years, including only cities with population 5,000 and above)
| Pflugerville: | 20.1 |
| Round Rock: | 17.3 |
| Manor: | 38.5 |
| Jollyville: | 0.6 |
| Hutto: | 42.8 |
| Austin: | 17.6 |
| Cedar Park: | 18.8 |
| Georgetown: | 32.1 |
| Taylor: | 46.1 |
 The median response time based on all reported fire incidents is 7 minutes. This is similar to the Texas median value.
The median response time in Pflugerville, TX compared to nearest cities:
(Note: Based on data for all years, including only cities with at least 500 fire incidents)
| Pflugerville: | 7 minutes |
| Round Rock: | 5 minutes |
| Manor: | 8 minutes |
| Hutto: | 8 minutes |
| Austin: | 5 minutes |
| Cedar Park: | 6 minutes |
| Georgetown: | 7 minutes |
| Taylor: | 7 minutes |
| Leander: | 7 minutes |
 27.5% incidents where reported in the morning and 72.5% in the evening. The most fires (16.2%) took place on Saturday, and the least (12.9%) on Wednesday.
 Based on the 2,390 reports from years 2003 - 2018 most fires (10.1%) took place during July, and the least (6.6%) in February.
 Out of all 24,026 cases reported during the years 2003 - 2018, the most belonged to the categories: Rescue & EMS (60.6%), Fire (9.9%), and Good Intent Call (9.3%).
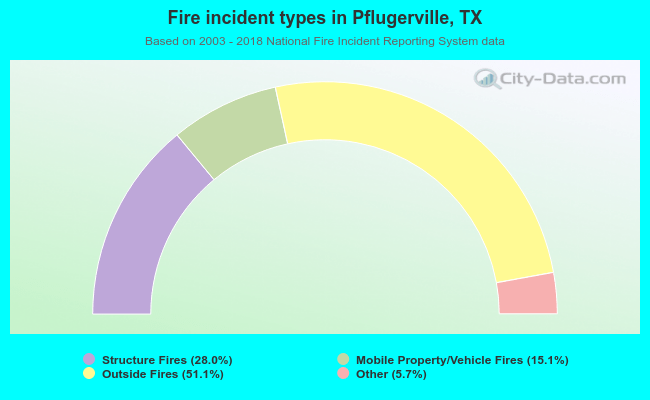 When looking into fire subcategories, the most incidents belonged to: Outside Fires (51.1%), and Structure Fires (28.0%).