Poughkeepsie: Fire Incidents, New York (NY)
Where are fire incidents reported in Poughkeepsie, NY
Something went wrong! Please refresh the page.
| Fire incidents reported | |
|---|---|
| Sreet name | Count |
| NORTH RD | 500 |
| CREEK RD | 346 |
| MONTGOMERY ST | 252 |
| HUDSON AVENUE EXT | 228 |
| MAIN ST | 214 |
| SOUTH RD | 210 |
| MAIN ST | 202 |
| VIOLET AVE | 200 |
| BREWERS LN | 172 |
| VAN WAGNER RD | 170 |
| FULTON ST | 108 |
| MANCHESTER RD | 106 |
| SOUTH RD | 104 |
| ACADEMY ST | 94 |
| CANNON ST | 94 |
| W CEDAR ST | 94 |
| BROOKSIDE AV | 90 |
| MANSION ST | 90 |
| MILL ST | 90 |
| WASHINGTON ST | 86 |
| WOODYS WAY | 86 |
| DUTCHESS TPKE | 76 |
| FREEDOM PLAINS RD | 76 |
| HAMILTON ST | 76 |
| MONTGOMERY ST | 72 |
| NOXON RD | 72 |
| TERRACE LN | 70 |
| TITUSVILLE RD | 66 |
| CHURCH ST | 62 |
| WASHINGTON ST | 60 |
| Other | 2,111 |
2002 - 2018 National Fire Incident Reporting System (NFIRS) incidents
- Incident types reported to NFIRS in Poughkeepsie, NY
- 44,76064.0%Rescue & EMS
- 7,47910.7%False Alarm
- 6,4349.2%Hazardous Condition
- 6,2779.0%Fire
- 2,4583.5%Service Call
- 2,4023.4%Good Intent Call
- Fire incident types reported to NFIRS in Poughkeepsie, NY
- 4,33669.1%Structure Fires
- 1,21219.3%Outside Fires
- 5158.2%Mobile Property/Vehicle Fires
- 2143.4%Other
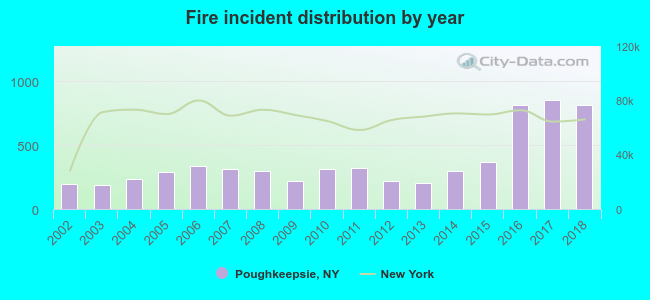 Based on the data from the years 2002 - 2018 the average number of fires per year is 369. The highest number of reported fires - 851 took place in 2017, and the least - 186 in 2003. The data has an increasing trend.
The average number of yearly fire incidents per 10k residents in Poughkeepsie, NY compared to nearest cities:
(Note: Based on data for the last 3 years, including only cities with population 5,000 and above)
| Poughkeepsie: | 271.6 |
| Fairview: | 1.8 |
| Highland: | 51.9 |
| Lloyd: | 1.8 |
| Hyde Park: | 57.2 |
| Wappingers Falls: | 152.6 |
| Wappinger: | 5.2 |
| New Paltz: | 63.6 |
| East Fishkill: | 0.9 |
 The median response time based on all reported fire incidents is 5 minutes. This is higher compared to the state median value.
The median response time in Poughkeepsie, NY compared to nearest cities:
(Note: Based on data for all years, including only cities with at least 500 fire incidents)
| Poughkeepsie: | 5 minutes |
| Pleasant Valley: | 7 minutes |
| Hyde Park: | 7 minutes |
| Wappingers Falls: | 6 minutes |
| New Paltz: | 5 minutes |
| Hopewell Junction: | 9 minutes |
| Fishkill: | 5 minutes |
| Millbrook: | 10 minutes |
| Beacon: | 3 minutes |
 Based on the data from the years 2002 - 2018 the average number of fire-related yearly deaths is 0. The highest number of reported deaths - 3 took place in 2015, and the lowest - 0 in 2002. The data has a constant trend.
The average number of fatalities per 1,000 fire incidents is 1. This indicator was the highest - 8 in 2015, and the lowest 0 in 2002. The trend for deaths per 1,000 incidents is constant. Compared to the state value the number of fatalities per 1,000 incidents is about the same.
Based on the data from the years 2002 - 2018 the average number of fire-related yearly deaths is 0. The highest number of reported deaths - 3 took place in 2015, and the lowest - 0 in 2002. The data has a constant trend.
The average number of fatalities per 1,000 fire incidents is 1. This indicator was the highest - 8 in 2015, and the lowest 0 in 2002. The trend for deaths per 1,000 incidents is constant. Compared to the state value the number of fatalities per 1,000 incidents is about the same.
 Based on the reports from the years 2002 - 2018 the average number of fire-related yearly casualties is 4. The highest number of injuries - 17 took place in 2011, and the lowest - 0 in 2005. The data has a constant trend.
The average number of injuries per 1,000 fire incidents is 13. This indicator was the highest - 53 in 2011, and the lowest 0 in 2005. The trend for casualties per 1,000 fires is dropping. Compared to the New York value the number of casualties per 1,000 fire incidents is about the same.
Based on the reports from the years 2002 - 2018 the average number of fire-related yearly casualties is 4. The highest number of injuries - 17 took place in 2011, and the lowest - 0 in 2005. The data has a constant trend.
The average number of injuries per 1,000 fire incidents is 13. This indicator was the highest - 53 in 2011, and the lowest 0 in 2005. The trend for casualties per 1,000 fires is dropping. Compared to the New York value the number of casualties per 1,000 fire incidents is about the same.Casualties per 1,000 incidents in Poughkeepsie, NY compared to nearest cities:
(Note: Based on data for all years, including only cities with at least 500 fire incidents)
| Poughkeepsie: | 10.0 |
| Pleasant Valley: | 17.2 |
| Hyde Park: | 1.8 |
| Wappingers Falls: | 4.4 |
| New Paltz: | 9.5 |
| Hopewell Junction: | 1.0 |
| Fishkill: | 0.0 |
| Millbrook: | 0.0 |
| Beacon: | 5.5 |
 30.4% incidents where reported in the morning and 69.6% in the evening. The most fires (15.2%) took place on Saturday, and the least (13.5%) on Wednesday.
 According to the 6,277 fire incident reports from years 2002 - 2018 most fires (10.1%) took place during April, and the least (7.0%) in August.
 Out of all 69,930 cases reported during the years 2002 - 2018, the most belonged to the categories: Rescue & EMS (64.0%), False Alarm (10.7%), and Hazardous Condition (9.2%).
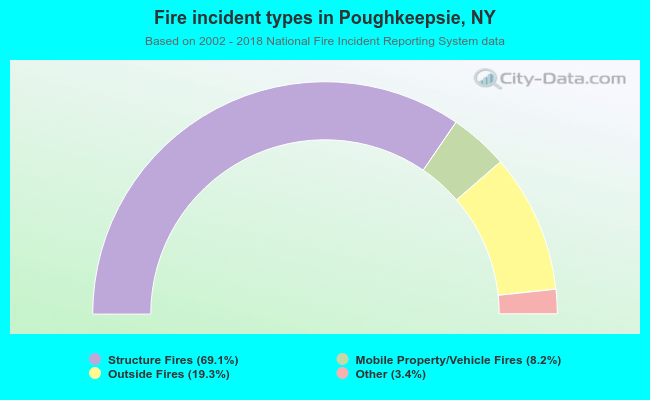 When looking into fire subcategories, the most reports belonged to: Structure Fires (69.1%), and Outside Fires (19.3%).