Riverside: Fire Incidents, California (CA)
Where are fire incidents reported in Riverside, CA
Something went wrong! Please refresh the page.
| Fire incidents reported | |
|---|---|
| Sreet name | Count |
| MAGNOLIA AVE | 780 |
| ARLINGTON AVE | 474 |
| VAN BUREN BLVD | 434 |
| UNIVERSITY AVE | 358 |
| LA SIERRA AVE | 246 |
| INDIANA AVE | 226 |
| JURUPA AVE | 210 |
| CENTRAL AVE | 182 |
| MISSION INN AVE | 174 |
| TYLER | 166 |
| BROCKTON AVE | 160 |
| IOWA AVE | 160 |
| CHICAGO AVE | 140 |
| CANYON CREST DR | 136 |
| FAIRMOUNT BLVD | 136 |
| ALESSANDRO BLVD | 128 |
| VICTORIA AVE | 124 |
| JACKSON | 122 |
| MAIN | 106 |
| ORANGE | 92 |
| BLAINE | 84 |
| COLUMBIA AVE | 80 |
| CYPRESS AVE | 76 |
| LINCOLN AVE | 76 |
| SYCAMORE CANYON BLVD | 72 |
| HOLE AVE | 70 |
| CALIFORNIA AVE | 66 |
| DOOLITTLE AVE | 66 |
| JONES AVE | 66 |
| OLIVEWOOD AVE | 66 |
| Other | 3,624 |
2005 - 2018 National Fire Incident Reporting System (NFIRS) incidents
- Incident types reported to NFIRS in Riverside, CA
- 85,05666.5%Rescue & EMS
- 17,27213.5%Good Intent Call
- 8,9007.0%Fire
- 6,9985.5%Service Call
- 5,3684.2%Hazardous Condition
- 3,9573.1%False Alarm
- 2740.2%Overpressure Rupture
- 1350.1%Special Incident
- Fire incident types reported to NFIRS in Riverside, CA
- 4,62652.0%Outside Fires
- 2,24725.2%Structure Fires
- 1,91821.6%Mobile Property/Vehicle Fires
- 1091.2%Other
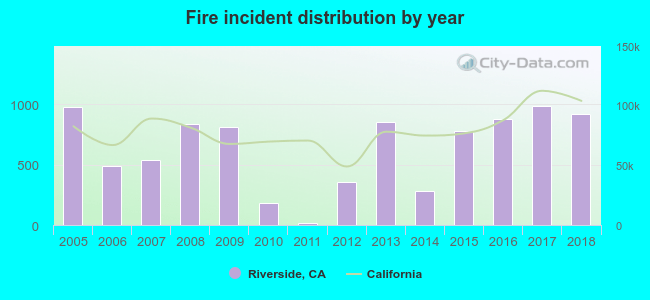 Based on the data from the years 2005 - 2018 the average number of fire incidents per year is 636. The highest number of fires - 988 took place in 2017, and the least - 15 in 2011. The data has a dropping trend.
The average number of yearly fire incidents per 10k residents in Riverside, CA compared to nearest cities:
(Note: Based on data for the last 3 years, including only cities with population 5,000 and above)
| Riverside: | 29.1 |
| Rubidoux: | 1.3 |
| Woodcrest: | 1.0 |
| Jurupa: | 0.1 |
| Grand Terrace: | 8.3 |
| Bloomington: | 11.2 |
| Home Gardens: | 0.9 |
| Colton: | 60.0 |
| Norco: | 1.0 |
 The median response time based on all reported fire incidents is 6 minutes. This is close to the California median value.
The median response time in Riverside, CA compared to nearest cities:
(Note: Based on data for all years, including only cities with at least 500 fire incidents)
| Riverside: | 6 minutes |
| Colton: | 7 minutes |
| Loma Linda: | 6 minutes |
| Fontana: | 7 minutes |
| Corona: | 6 minutes |
| Rialto: | 8 minutes |
| San Bernardino: | 7 minutes |
| Redlands: | 6 minutes |
| Ontario: | 6 minutes |
 According to the reports from the years 2005 - 2018 the average number of fire-related yearly deaths is 2. The highest number of deaths - 5 took place in 2005, and the lowest - 0 in 2006. The data has a decreasing trend.
The average number of fatalities per 1,000 fire incidents is 2. This indicator was the highest - 11 in 2012, and the lowest 0 in 2006. The trend for deaths per 1,000 fire incidents is dropping. Compared to the state value the number of deaths per 1,000 fires is higher.
According to the reports from the years 2005 - 2018 the average number of fire-related yearly deaths is 2. The highest number of deaths - 5 took place in 2005, and the lowest - 0 in 2006. The data has a decreasing trend.
The average number of fatalities per 1,000 fire incidents is 2. This indicator was the highest - 11 in 2012, and the lowest 0 in 2006. The trend for deaths per 1,000 fire incidents is dropping. Compared to the state value the number of deaths per 1,000 fires is higher.Deaths per 1,000 incidents in Riverside, CA compared to nearest cities:
(Note: Based on data for all years, including only cities with at least 2,500 fire incidents)
| Riverside: | 2.5 |
| Colton: | 2.8 |
| Redlands: | 0.6 |
| Ontario: | 1.6 |
| Rancho Cucamonga: | 1.5 |
| Pomona: | 0.5 |
 Based on the reports from the years 2005 - 2018 the average number of fire-related casualties per year is 15. The highest number of casualties - 30 took place in 2013, and the lowest - 0 in 2011. The data has a declining trend.
The average number of casualties per 1,000 fire incidents is 21. This indicator was the highest - 47 in 2014, and the lowest 0 in 2011. The trend for casualties per 1,000 fires is declining. Compared to the state value the number of injuries per 1,000 fire incidents is much higher.
Based on the reports from the years 2005 - 2018 the average number of fire-related casualties per year is 15. The highest number of casualties - 30 took place in 2013, and the lowest - 0 in 2011. The data has a declining trend.
The average number of casualties per 1,000 fire incidents is 21. This indicator was the highest - 47 in 2014, and the lowest 0 in 2011. The trend for casualties per 1,000 fires is declining. Compared to the state value the number of injuries per 1,000 fire incidents is much higher.Casualties per 1,000 incidents in Riverside, CA compared to nearest cities:
(Note: Based on data for all years, including only cities with at least 500 fire incidents)
| Riverside: | 23.0 |
| Colton: | 4.0 |
| Loma Linda: | 5.9 |
| Fontana: | 2.1 |
| Corona: | 15.8 |
| Rialto: | 14.3 |
| San Bernardino: | 4.3 |
| Redlands: | 5.5 |
| Ontario: | 14.5 |
 34.3% incidents where reported in the morning and 65.7% in the evening. The most fires (15.4%) took place on Saturday, and the least (13.7%) on Tuesday.
 Based on the 8,900 incident reports from years 2005 - 2018 most fires (9.4%) took place during January, and the least (6.7%) in September.
 Out of all 127,970 cases reported during the years 2005 - 2018, the most belonged to the categories: Rescue & EMS (66.5%), Good Intent Call (13.5%), and Fire (7.0%).
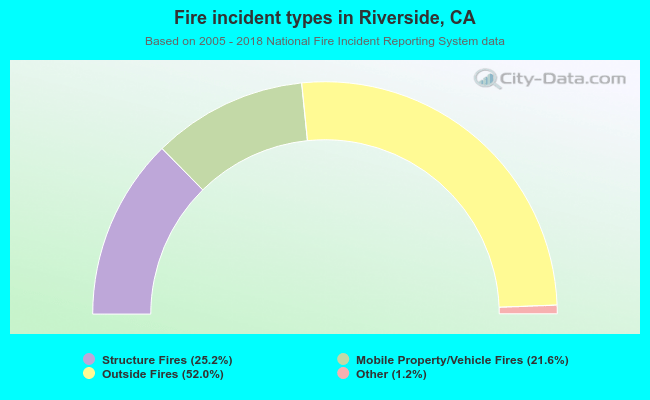 When looking into fire subcategories, the most reports belonged to: Outside Fires (52.0%), and Structure Fires (25.2%).