San Lorenzo: Fire Incidents, California (CA)
Where are fire incidents reported in San Lorenzo, CA
Something went wrong! Please refresh the page.
|
| |||||||||||||||||||||||||||||||||||||||||||||||||||||||||||||||||||||||||||||||||||||||||||||||||||||||||||||
2005 - 2018 National Fire Incident Reporting System (NFIRS) incidents
- Incident types reported to NFIRS in San Lorenzo, CA
- 4,79264.9%Rescue & EMS
- 7259.8%Good Intent Call
- 6719.1%Fire
- 4616.2%Hazardous Condition
- 4616.2%Service Call
- 2613.5%False Alarm
- Fire incident types reported to NFIRS in San Lorenzo, CA
- 30245.0%Structure Fires
- 22233.1%Outside Fires
- 13620.3%Mobile Property/Vehicle Fires
- 111.6%Other
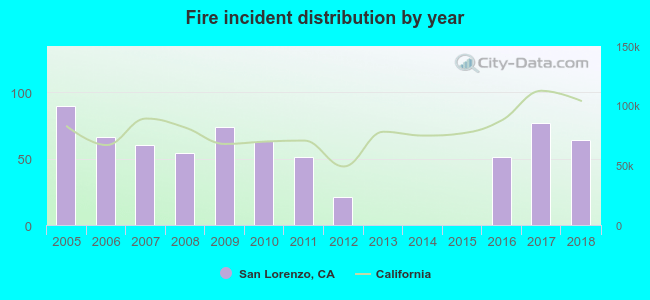 Based on the data from the years 2005 - 2018 the average number of fires per year is 48. The highest number of reported fire incidents - 90 took place in 2005, and the least - 0 in 2013. The data has a decreasing trend.
The average number of yearly fire incidents per 10k residents in San Lorenzo, CA compared to nearest cities:
(Note: Based on data for the last 3 years, including only cities with population 5,000 and above)
| San Lorenzo: | 27.3 |
| San Leandro: | 33.1 |
| Castro Valley: | 14.8 |
| Hayward: | 3.3 |
| Union City: | 18.2 |
| Alameda: | 20.8 |
| Oakland: | 37.6 |
| Newark: | 22.2 |
| Foster City: | 10.7 |
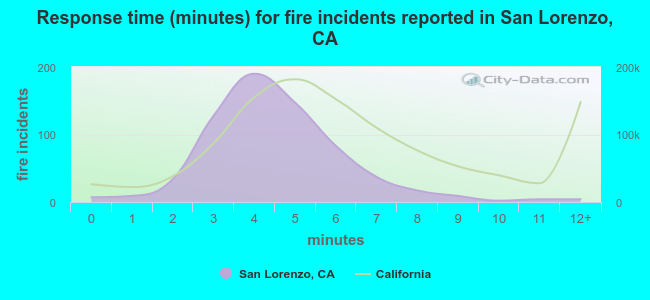 The median response time based on all reported fire incidents is 4 minutes. This is lower compared to the state median value.
The median response time in San Lorenzo, CA compared to nearest cities:
(Note: Based on data for all years, including only cities with at least 500 fire incidents)
| San Lorenzo: | 4 minutes |
| San Leandro: | 4 minutes |
| Castro Valley: | 5 minutes |
| Hayward: | 4 minutes |
| Union City: | 5 minutes |
| Alameda: | 4 minutes |
| Oakland: | 5 minutes |
| Newark: | 4 minutes |
| Foster City: | 4 minutes |
 35.5% incidents where reported in the morning and 64.5% in the evening. The most fires (15.6%) took place on Friday, and the least (12.2%) on Wednesday.
 Based on the 671 fires from years 2005 - 2018 most fires (11.2%) took place during July, and the least (5.7%) in February.
 Out of all 7,378 cases reported during the years 2005 - 2018, the most belonged to the categories: Overpressure Rupture (64.9%), Service Call (9.8%), and Fire (9.1%).
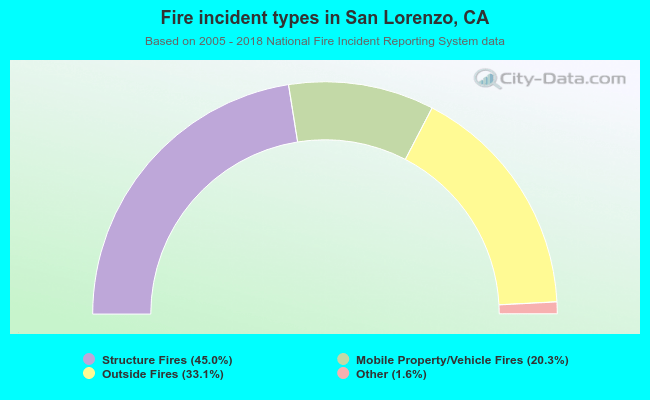 When looking into fire subcategories, the most reports belonged to: Structure Fires (45.0%), and Outside Fires (33.1%).