Santa Clara: Fire Incidents, California (CA)
Where are fire incidents reported in Santa Clara, CA
Something went wrong! Please refresh the page.
|
| |||||||||||||||||||||||||||||||||||||||||||||||||||||||||||||||||||||||||||||||||||||||||||||||||||||||||||||
2005 - 2018 National Fire Incident Reporting System (NFIRS) incidents
- Incident types reported to NFIRS in Santa Clara, CA
- 1,58563.7%Rescue & EMS
- 28811.6%False Alarm
- 2118.5%Service Call
- 1947.8%Good Intent Call
- 1104.4%Fire
- 913.7%Hazardous Condition
- 70.3%Special Incident
- Fire incident types reported to NFIRS in Santa Clara, CA
- 5247.3%Structure Fires
- 3430.9%Outside Fires
- 1210.9%Mobile Property/Vehicle Fires
- 1210.9%Other
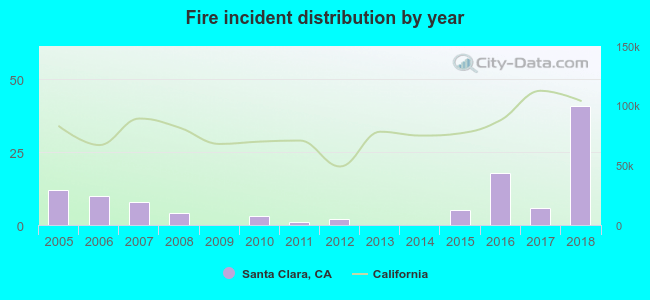 Based on the data from the years 2005 - 2018 the average number of fire incidents per year is 8. The highest number of reported fire incidents - 41 took place in 2018, and the least - 0 in 2009. The data has a growing trend.
The average number of yearly fire incidents per 10k residents in Santa Clara, CA compared to nearest cities:
(Note: Based on data for the last 3 years, including only cities with population 5,000 and above)
| Santa Clara: | 1.8 |
| Sunnyvale: | 9.6 |
| Cupertino: | 13.1 |
| Campbell: | 20.7 |
| Saratoga: | 8.6 |
| San Jose: | 15.6 |
| Mountain View: | 5.5 |
| Milpitas: | 12.6 |
| Los Altos: | 11.9 |
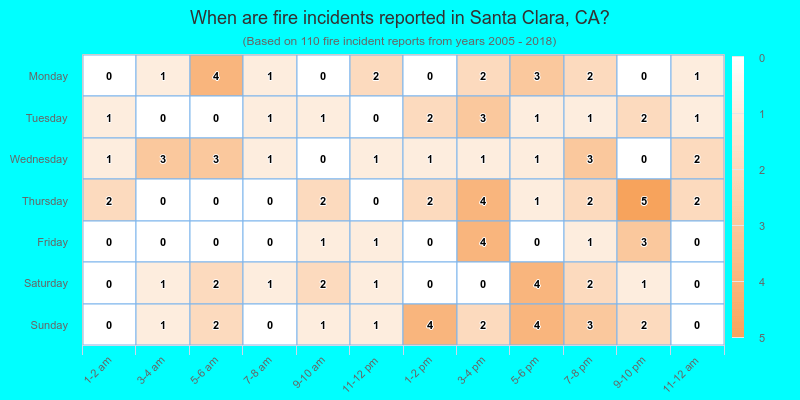
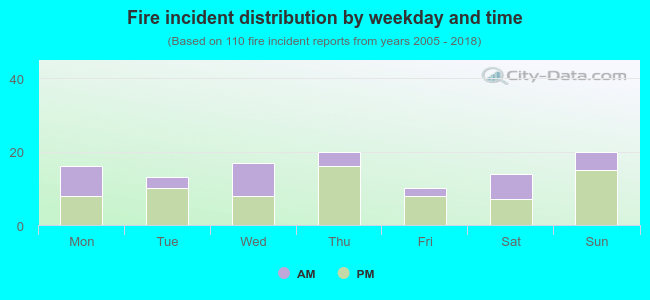 34.5% incidents where reported in the morning and 65.5% in the evening. The most fires (18.2%) took place on Thursday, and the least (9.1%) on Friday.
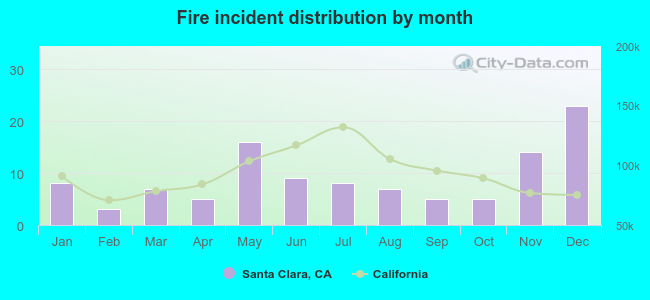 According to the 110 incident reports from years 2005 - 2018 most fires (20.9%) took place during December, and the least (2.7%) in February.
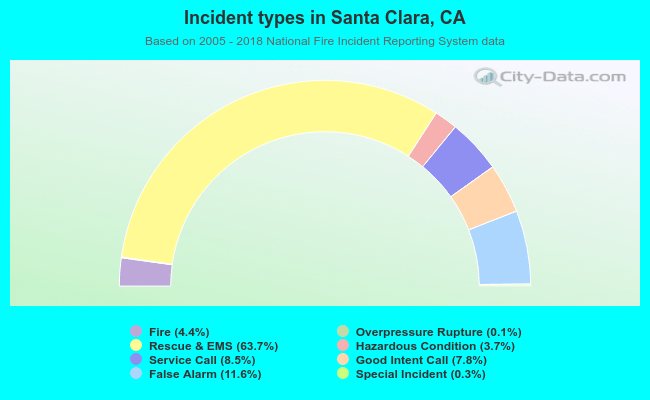 Out of all 2,488 cases reported during the years 2005 - 2018, the most belonged to the categories: Rescue & EMS (63.7%), False Alarm (11.6%), and Service Call (8.5%).
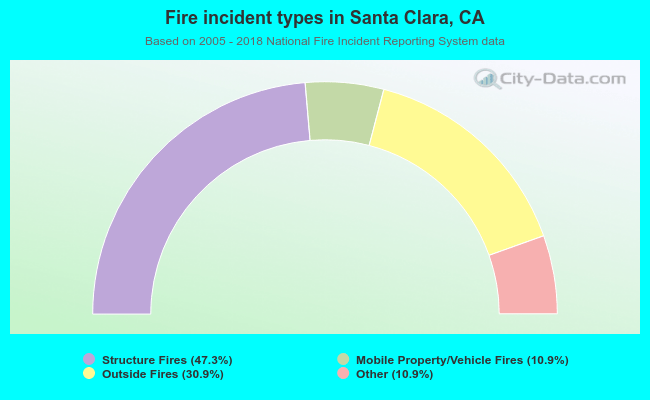 When looking into fire subcategories, the most reports belonged to: Structure Fires (47.3%), and Outside Fires (30.9%).