Shawano: Fire Incidents, Wisconsin (WI)
Where are fire incidents reported in Shawano, WI
Something went wrong! Please refresh the page.
|
| |||||||||||||||||||||||||||||||||||||||||||||||||||||||||||||||||||||||||||||||||||||||||||||||||||||||||||||
| Other | 78 | |||||||||||||||||||||||||||||||||||||||||||||||||||||||||||||||||||||||||||||||||||||||||||||||||||||||||||||
2002 - 2018 National Fire Incident Reporting System (NFIRS) incidents
- Incident types reported to NFIRS in Shawano, WI
- 49642.0%Fire
- 28524.2%Hazardous Condition
- 15212.9%False Alarm
- 13711.6%Rescue & EMS
- 847.1%Good Intent Call
- 171.4%Service Call
- 40.3%Overpressure Rupture
- 40.3%Special Incident
- Fire incident types reported to NFIRS in Shawano, WI
- 23747.8%Structure Fires
- 13727.6%Outside Fires
- 8817.7%Mobile Property/Vehicle Fires
- 346.9%Other
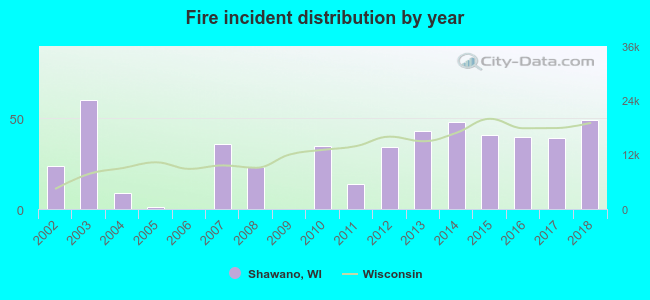 Based on the data from the years 2002 - 2018 the average number of fires per year is 29. The highest number of fire incidents - 60 took place in 2003, and the least - 0 in 2006. The data has a growing trend.
The average number of yearly fire incidents per 10k residents in Shawano, WI compared to nearest cities:
(Note: Based on data for the last 3 years, including only cities with population 5,000 and above)
| Shawano: | 46.5 |
| New London: | 51.3 |
| Suamico: | 9.5 |
| Hobart: | 5.1 |

 29.2% incidents where reported in the morning and 70.8% in the evening. The most fires (17.1%) took place on Monday, and the least (12.5%) on Thursday.
 Based on the 496 fire incidents from years 2002 - 2018 most fires (15.5%) took place during April, and the least (4.2%) in September.
 Out of all 1,180 cases reported during the years 2002 - 2018, the most belonged to the categories: Fire (42.0%), Hazardous Condition (24.2%), and False Alarm (12.9%).
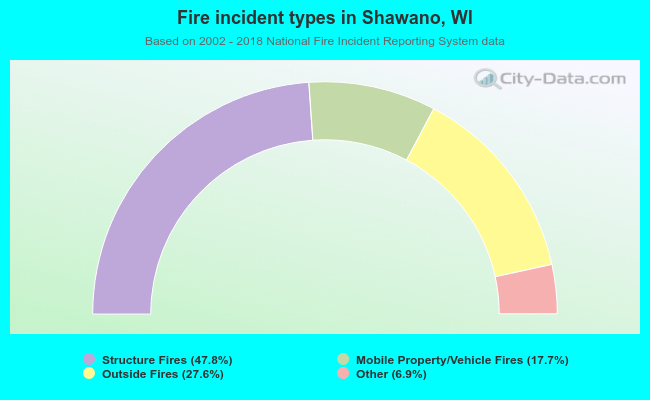 When looking into fire subcategories, the most reports belonged to: Structure Fires (47.8%), and Outside Fires (27.6%).