Starkville: Fire Incidents, Mississippi (MS)
Where are fire incidents reported in Starkville, MS
Something went wrong! Please refresh the page.
| Fire incidents reported | |
|---|---|
| Sreet name | Count |
| HIGHWAY 12 HWY | 138 |
| MONTGOMERY ST | 128 |
| LOUISVILLE ST | 118 |
| LYNN LN | 106 |
| HIGHWAY 182 HWY | 90 |
| HIGHWAY 82 HWY | 86 |
| REED RD | 74 |
| JACKSON ST | 66 |
| BLACKJACK RD | 64 |
| SPRUILL INDUSTRIAL PARK RD | 60 |
| HWY 12 | 58 |
| EVERGLADE AVE | 56 |
| OLD WEST POINT RD | 56 |
| MAIN ST | 54 |
| STARK RD | 52 |
| YELLOW JACKET DR | 52 |
| INDUSTRIAL PARK RD | 48 |
| 12 HWY | 46 |
| UNIVERSITY DR | 44 |
| WILLIAMS RD | 44 |
| NEW LIGHT | 42 |
| SAND RD | 42 |
| ROCKHILL RD | 40 |
| HIGHWAY 25 HWY | 36 |
| 16TH SECTION RD | 34 |
| 25 HWY | 32 |
| BETHEL RD | 32 |
| HWY 25 | 32 |
| OKTOC RD | 32 |
| LONG ST | 30 |
| Other | 762 |
2002 - 2018 National Fire Incident Reporting System (NFIRS) incidents
- Incident types reported to NFIRS in Starkville, MS
- 5,65447.0%Rescue & EMS
- 2,55421.2%Fire
- 1,60113.3%False Alarm
- 1,0038.3%Hazardous Condition
- 9127.6%Good Intent Call
- 2382.0%Service Call
- 480.4%Overpressure Rupture
- 160.1%Special Incident
- Fire incident types reported to NFIRS in Starkville, MS
- 1,24248.6%Structure Fires
- 83932.9%Outside Fires
- 46318.1%Mobile Property/Vehicle Fires
- 100.4%Other
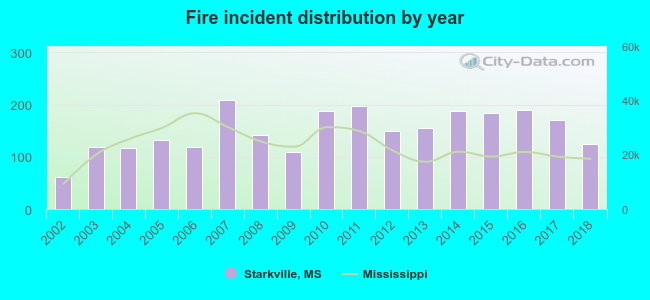 Based on the data from the years 2002 - 2018 the average number of fire incidents per year is 150. The highest number of reported fires - 208 took place in 2007, and the least - 62 in 2002. The data has an increasing trend.
The average number of yearly fire incidents per 10k residents in Starkville, MS compared to nearest cities:
(Note: Based on data for the last 3 years, including only cities with population 5,000 and above)
| Starkville: | 64.8 |
| West Point: | 91.0 |
| Columbus: | 55.2 |
| Louisville: | 176.0 |
| Aberdeen: | 182.3 |
| Amory: | 111.2 |
| Philadelphia: | 255.8 |
| Kosciusko: | 78.3 |
| Tupelo: | 81.8 |
 The median response time based on all reported fire incidents is 5 minutes. This is lower compared to the Mississippi median value.
The median response time in Starkville, MS compared to nearest cities:
(Note: Based on data for all years, including only cities with at least 500 fire incidents)
| Starkville: | 5 minutes |
| West Point: | 4 minutes |
| Ackerman: | 8 minutes |
| Columbus: | 5 minutes |
| Eupora: | 8 minutes |
| Louisville: | 8 minutes |
| Macon: | 6 minutes |
| Aberdeen: | 3 minutes |
| Houston: | 7 minutes |
 Based on the reports from the years 2002 - 2018 the average number of fire-related fatalities per year is 1. The highest number of deaths - 10 took place in 2009, and the lowest - 0 in 2002. The data has a constant trend.
The average number of deaths per 1,000 fire incidents is 10. This indicator was the highest - 91 in 2009, and the lowest 0 in 2002. The trend for fatalities per 1,000 fires is constant. Compared to the Mississippi value the number of fatalities per 1,000 incidents is much higher.
Based on the reports from the years 2002 - 2018 the average number of fire-related fatalities per year is 1. The highest number of deaths - 10 took place in 2009, and the lowest - 0 in 2002. The data has a constant trend.
The average number of deaths per 1,000 fire incidents is 10. This indicator was the highest - 91 in 2009, and the lowest 0 in 2002. The trend for fatalities per 1,000 fires is constant. Compared to the Mississippi value the number of fatalities per 1,000 incidents is much higher.Deaths per 1,000 incidents in Starkville, MS compared to nearest cities:
(Note: Based on data for all years, including only cities with at least 2,500 fire incidents)
| Starkville: | 8.2 |
| Columbus: | 1.6 |
| Louisville: | 3.5 |
| Philadelphia: | 6.5 |
| Tupelo: | 2.8 |
 According to the data from the years 2002 - 2018 the average number of fire-related yearly casualties is 0. The highest number of reported injuries - 2 took place in 2017, and the lowest - 0 in 2002. The data has a constant trend.
The average number of casualties per 1,000 fire incidents is 2. This indicator was the highest - 12 in 2017, and the lowest 0 in 2002. The trend for injuries per 1,000 fire incidents is constant. Compared to the state value the number of casualties per 1,000 fires is lower.
According to the data from the years 2002 - 2018 the average number of fire-related yearly casualties is 0. The highest number of reported injuries - 2 took place in 2017, and the lowest - 0 in 2002. The data has a constant trend.
The average number of casualties per 1,000 fire incidents is 2. This indicator was the highest - 12 in 2017, and the lowest 0 in 2002. The trend for injuries per 1,000 fire incidents is constant. Compared to the state value the number of casualties per 1,000 fires is lower.Casualties per 1,000 incidents in Starkville, MS compared to nearest cities:
(Note: Based on data for all years, including only cities with at least 500 fire incidents)
| Starkville: | 2.7 |
| West Point: | 1.9 |
| Ackerman: | 1.9 |
| Columbus: | 1.6 |
| Eupora: | 5.7 |
| Louisville: | 4.6 |
| Macon: | 0.0 |
| Aberdeen: | 0.0 |
| Houston: | 6.3 |
 31.6% incidents where reported in the morning and 68.4% in the evening. The most fires (16.1%) took place on Thursday, and the least (12.8%) on Friday.
 According to the 2,554 fire incidents from years 2002 - 2018 most fires (10.5%) took place during January, and the least (5.9%) in June.
 Out of all 12,031 cases reported during the years 2002 - 2018, the most belonged to the categories: Rescue & EMS (47.0%), Fire (21.2%), and False Alarm (13.3%).
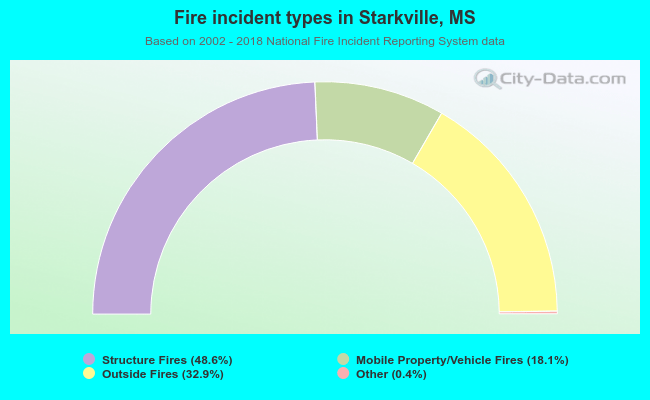 When looking into fire subcategories, the most reports belonged to: Structure Fires (48.6%), and Outside Fires (32.9%).