Sun Valley: Fire Incidents, Nevada (NV)
Where are fire incidents reported in Sun Valley, NV
Something went wrong! Please refresh the page.
|
| |||||||||||||||||||||||||||||||||||||||||||||||||||||||||||||||||||||||||||||||||||||||||||||||||||||||||||||
2003 - 2018 National Fire Incident Reporting System (NFIRS) incidents
- Incident types reported to NFIRS in Sun Valley, NV
- 4,58870.2%Rescue & EMS
- 5808.9%Good Intent Call
- 5097.8%Service Call
- 4577.0%Fire
- 3024.6%Hazardous Condition
- 921.4%False Alarm
- 80.1%Severe Weather
- Fire incident types reported to NFIRS in Sun Valley, NV
- 18941.4%Outside Fires
- 18640.7%Structure Fires
- 7516.4%Mobile Property/Vehicle Fires
- 71.5%Other
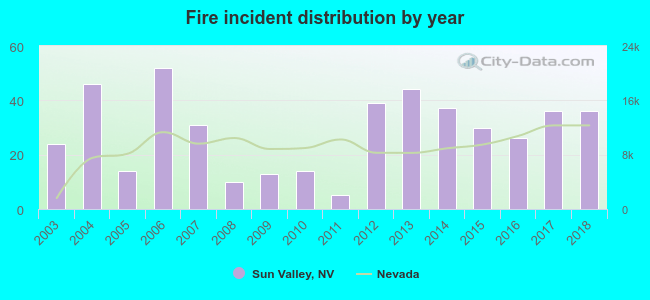 According to the data from the years 2003 - 2018 the average number of fires per year is 29. The highest number of fire incidents - 52 took place in 2006, and the least - 5 in 2011. The data has a rising trend.
The average number of yearly fire incidents per 10k residents in Sun Valley, NV compared to nearest cities:
(Note: Based on data for the last 3 years, including only cities with population 5,000 and above)
| Sun Valley: | 16.9 |
| Sparks: | 38.7 |
| Lemmon Valley: | 2.0 |
| Reno: | 41.0 |
| Spanish Springs: | 2.4 |
| Cold Springs: | 5.9 |
| Washoe Valley: | 14.4 |
| Incline Village: | 20.3 |
| Dayton: | 45.0 |

 Based on the reports from the years 2003 - 2018 the average number of fire-related yearly casualties is 1. The highest number of injuries - 4 took place in 2017, and the lowest - 0 in 2004. The data has a dropping trend.
 30.4% incidents where reported in the morning and 69.6% in the evening. The most fires (16.0%) took place on Sunday, and the least (11.4%) on Friday.
 According to the 457 fire incident reports from years 2003 - 2018 most fires (13.8%) took place during July, and the least (4.2%) in April.
 Out of all 6,540 cases reported during the years 2003 - 2018, the most belonged to the categories: Rescue & EMS (70.2%), Good Intent Call (8.9%), and Service Call (7.8%).
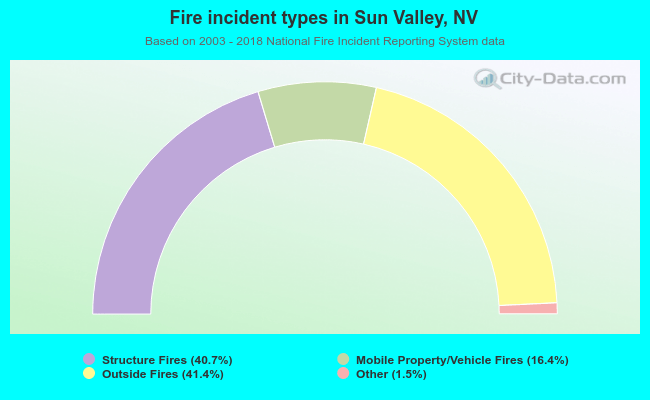 When looking into fire subcategories, the most reports belonged to: Outside Fires (41.4%), and Structure Fires (40.7%).