Troy: Fire Incidents, Ohio (OH)
Where are fire incidents reported in Troy, OH
Something went wrong! Please refresh the page.
| Fire incidents reported | |
|---|---|
| Sreet name | Count |
| MAIN ST | 198 |
| MARKET ST | 116 |
| DYE MILL RD | 64 |
| UNION ST | 56 |
| CORPORATE DR | 52 |
| COUNTY RD 25A RD | 38 |
| CANAL ST | 36 |
| MCKAIG AVE | 36 |
| TRADE SQ | 30 |
| DORSET RD | 28 |
| FRANKLIN ST | 28 |
| INTERSTATE I-75 | 28 |
| CHILDRENS HOME RD | 26 |
| CLAY ST | 26 |
| MUMFORD | 26 |
| ST RT 41 | 26 |
| WALNUT ST | 26 |
| STANFIELD RD | 24 |
| ELDEAN RD | 22 |
| MAIN MARKET | 22 |
| RUSK RD | 22 |
| LINCOLN AVE | 20 |
| LYTLE RD | 20 |
| MULBERRY ST | 20 |
| STAUNTON COMMONS DR | 20 |
| CRAWFORD ST | 18 |
| PETERS RD | 18 |
| RAPIDS RD | 18 |
| RIDGE AVE | 18 |
| SPRUCE ST | 18 |
| Other | 497 |
2002 - 2018 National Fire Incident Reporting System (NFIRS) incidents
- Incident types reported to NFIRS in Troy, OH
- 16,02973.9%Rescue & EMS
- 2,0709.5%Hazardous Condition
- 1,5977.4%Fire
- 1,1595.3%Good Intent Call
- 5702.6%False Alarm
- 2411.1%Service Call
- Fire incident types reported to NFIRS in Troy, OH
- 71444.7%Structure Fires
- 67742.4%Outside Fires
- 20412.8%Mobile Property/Vehicle Fires
- 20.1%Other
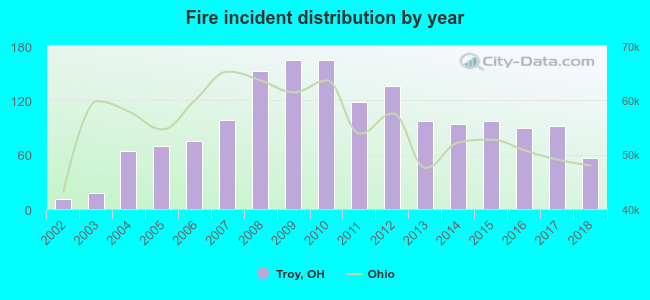 Based on the data from the years 2002 - 2018 the average number of fires per year is 94. The highest number of reported fire incidents - 165 took place in 2009, and the least - 11 in 2002. The data has a growing trend.
The average number of yearly fire incidents per 10k residents in Troy, OH compared to nearest cities:
(Note: Based on data for the last 3 years, including only cities with population 5,000 and above)
| Troy: | 30.9 |
| Tipp City: | 55.5 |
| Piqua: | 52.7 |
| Vandalia: | 55.9 |
| Union: | 18.8 |
| New Carlisle: | 93.9 |
| Englewood: | 42.9 |
| Huber Heights: | 30.3 |
| Clayton: | 22.0 |
 The median response time based on all reported fire incidents is 7 minutes. This is comparable to the state median value.
The median response time in Troy, OH compared to nearest cities:
(Note: Based on data for all years, including only cities with at least 500 fire incidents)
| Troy: | 7 minutes |
| Tipp City: | 10 minutes |
| Piqua: | 8 minutes |
| Vandalia: | 6 minutes |
| New Carlisle: | 8 minutes |
| Englewood: | 5 minutes |
| Huber Heights: | 6 minutes |
| Sidney: | 8 minutes |
| Trotwood: | 7 minutes |
 Based on the reports from the years 2002 - 2018 the average number of fire-related casualties per year is 0. The highest number of reported injuries - 3 took place in 2008, and the lowest - 0 in 2002. The data has a constant trend.
The average number of casualties per 1,000 fires is 3. This indicator was the highest - 20 in 2008, and the lowest 0 in 2002. The trend for injuries per 1,000 fires is constant. Compared to the Ohio value the number of casualties per 1,000 fires is much lower.
Based on the reports from the years 2002 - 2018 the average number of fire-related casualties per year is 0. The highest number of reported injuries - 3 took place in 2008, and the lowest - 0 in 2002. The data has a constant trend.
The average number of casualties per 1,000 fires is 3. This indicator was the highest - 20 in 2008, and the lowest 0 in 2002. The trend for injuries per 1,000 fires is constant. Compared to the Ohio value the number of casualties per 1,000 fires is much lower.Casualties per 1,000 incidents in Troy, OH compared to nearest cities:
(Note: Based on data for all years, including only cities with at least 500 fire incidents)
| Troy: | 4.4 |
| Tipp City: | 9.2 |
| Piqua: | 12.0 |
| Vandalia: | 34.9 |
| New Carlisle: | 4.3 |
| Englewood: | 27.4 |
| Huber Heights: | 35.6 |
| Sidney: | 34.0 |
| Trotwood: | 34.2 |
 29.6% incidents where reported in the morning and 70.4% in the evening. The most fires (15.8%) took place on Monday, and the least (12.8%) on Friday.
 According to the 1,597 fire incidents from years 2002 - 2018 most fires (10.2%) took place during April, and the least (7.1%) in February.
 Out of all 21,688 cases reported during the years 2002 - 2018, the most belonged to the categories: Rescue & EMS (73.9%), Hazardous Condition (9.5%), and Fire (7.4%).
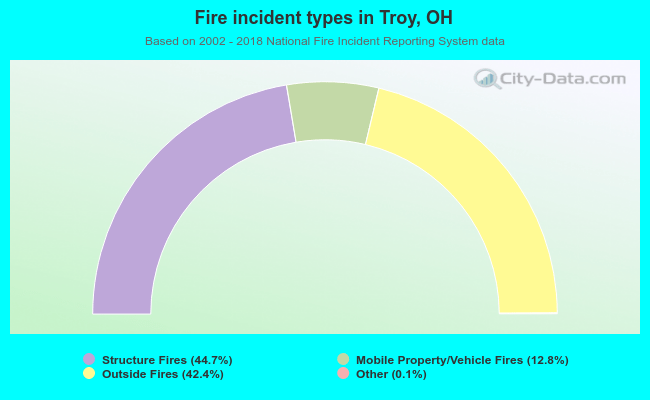 When looking into fire subcategories, the most reports belonged to: Structure Fires (44.7%), and Outside Fires (42.4%).