Walnut Creek: Fire Incidents, California (CA)
Where are fire incidents reported in Walnut Creek, CA
Something went wrong! Please refresh the page.
| Fire incidents reported | |
|---|---|
| Sreet name | Count |
| MAIN ST | 98 |
| YGNACIO VALLEY RD | 94 |
| CIVIC DR | 60 |
| OAK RD | 50 |
| CREEKSIDE DR | 42 |
| I 680 | 40 |
| TREAT BLVD | 34 |
| BROADWAY | 32 |
| LOCUST ST | 30 |
| GOLDEN RAIN RD | 26 |
| OLYMPIC BLVD | 26 |
| TICE VALLEY BLVD | 24 |
| FW 680 NB | 22 |
| BUENA VISTA AVE | 20 |
| CALIFORNIA BLVD | 20 |
| PTARMIGAN DR | 20 |
| ROCKLEDGE LN | 20 |
| SKYCREST DR | 20 |
| TICE CREEK DR | 20 |
| GEARY RD | 18 |
| MT DIABLO BLVD | 18 |
| NORTH GATE RD | 18 |
| SR 24 | 18 |
| WALNUT BLVD | 18 |
| WIGET LN | 18 |
| FW 680 SB | 16 |
| LA CASA VIA | 16 |
| NEWELL AVE | 16 |
| PEACHWILLOW LN | 16 |
| ROSSMOOR PKY | 16 |
| Other | 325 |
2005 - 2018 National Fire Incident Reporting System (NFIRS) incidents
- Incident types reported to NFIRS in Walnut Creek, CA
- 11,16759.3%Rescue & EMS
- 3,39718.0%Good Intent Call
- 1,2116.4%Fire
- 1,2086.4%Hazardous Condition
- 9735.2%False Alarm
- 8644.6%Service Call
- Fire incident types reported to NFIRS in Walnut Creek, CA
- 53043.8%Structure Fires
- 40833.7%Outside Fires
- 21117.4%Mobile Property/Vehicle Fires
- 625.1%Other
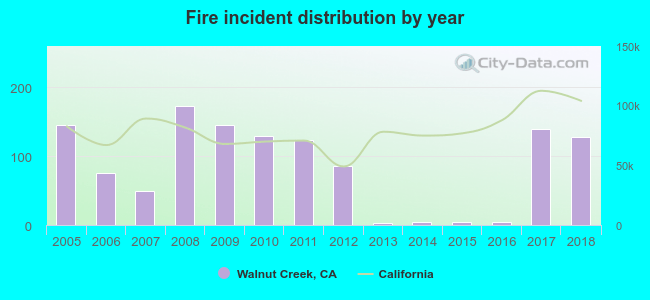 Based on the data from the years 2005 - 2018 the average number of fire incidents per year is 86. The highest number of reported fires - 173 took place in 2008, and the least - 3 in 2013. The data has a declining trend.
The average number of yearly fire incidents per 10k residents in Walnut Creek, CA compared to nearest cities:
(Note: Based on data for the last 3 years, including only cities with population 5,000 and above)
| Walnut Creek: | 13.3 |
| Pleasant Hill: | 25.1 |
| Alamo: | 12.1 |
| Lafayette: | 18.8 |
| Concord: | 16.0 |
| Moraga: | 14.9 |
| Clayton: | 19.4 |
| Orinda: | 26.1 |
| Martinez: | 21.8 |
 The median response time based on all reported fire incidents is 6 minutes. This is similar to the state median value.
The median response time in Walnut Creek, CA compared to nearest cities:
(Note: Based on data for all years, including only cities with at least 500 fire incidents)
| Walnut Creek: | 6 minutes |
| Pleasant Hill: | 6 minutes |
| Lafayette: | 7 minutes |
| Concord: | 6 minutes |
| Martinez: | 7 minutes |
| Danville: | 6 minutes |
| Bay Point: | 7 minutes |
| Pittsburg: | 6 minutes |
| San Ramon: | 5 minutes |
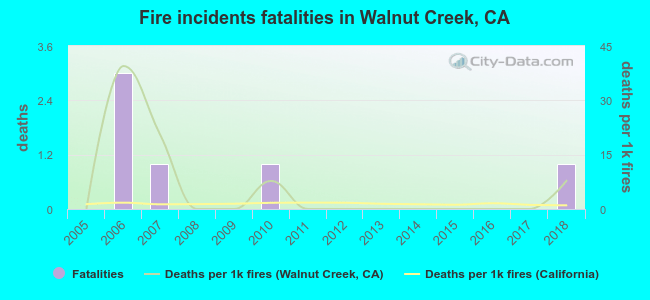 Based on the data from the years 2005 - 2018 the average number of fire-related yearly deaths is 0. The highest number of deaths - 3 took place in 2006, and the lowest - 0 in 2005. The data has an increasing trend.
 30.6% incidents where reported in the morning and 69.4% in the evening. The most fires (17.8%) took place on Saturday, and the least (12.4%) on Wednesday.
 According to the 1,211 fire incidents from years 2005 - 2018 most fires (12.3%) took place during July, and the least (6.4%) in November.
 Out of all 18,835 cases reported during the years 2005 - 2018, the most belonged to the categories: Rescue & EMS (59.3%), Good Intent Call (18.0%), and Fire (6.4%).
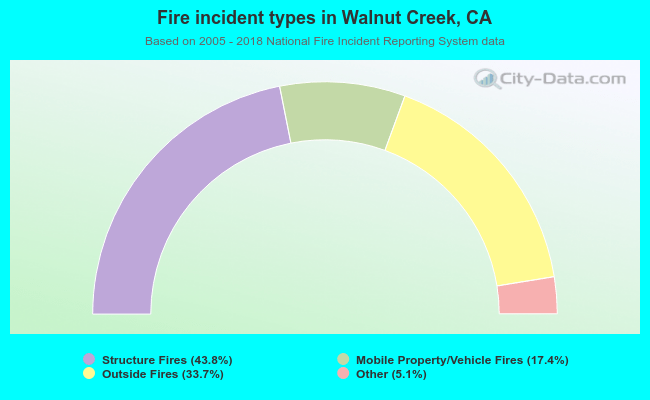 When looking into fire subcategories, the most incidents belonged to: Structure Fires (43.8%), and Outside Fires (33.7%).