West Columbia: Fire Incidents, South Carolina (SC)
Where are fire incidents reported in West Columbia, SC
Something went wrong! Please refresh the page.
| Fire incidents reported | |
|---|---|
| Sreet name | Count |
| CHARLESTON HWY | 402 |
| AUGUSTA RD | 358 |
| SUNSET BLVD | 316 |
| PLATT SPRINGS RD | 206 |
| INTERSTATE 26 FWY | 174 |
| LEAPHART RD | 160 |
| PINE ST | 112 |
| OLD DUNBAR RD | 100 |
| EDMUND HWY | 96 |
| DELREE ST | 76 |
| EMANUEL CHURCH RD | 70 |
| RIVERBEND DR | 70 |
| OLD BARNWELL RD | 66 |
| AIRPORT BLVD | 62 |
| FISH HATCHERY RD | 62 |
| GARDNERS TERRACE RD | 60 |
| MAIN ST | 60 |
| AVIATION WAY | 58 |
| ERMINE RD | 58 |
| MEETING ST | 52 |
| PRINCETON RD | 52 |
| BATCHELOR ST | 50 |
| GLENN RD | 50 |
| MCSWAIN DR | 50 |
| HOLLAND ST | 46 |
| 26 | 44 |
| 321 HWY | 44 |
| KITTI WAKE DR | 44 |
| OLD WIRE RD | 44 |
| SHADBLOW LN | 44 |
| Other | 1,155 |
2003 - 2018 National Fire Incident Reporting System (NFIRS) incidents
- Incident types reported to NFIRS in West Columbia, SC
- 8,99439.7%Rescue & EMS
- 4,24118.7%Fire
- 2,72612.0%Hazardous Condition
- 2,48811.0%Service Call
- 2,1629.5%Good Intent Call
- 1,9418.6%False Alarm
- 560.2%Overpressure Rupture
- 370.2%Severe Weather
- Fire incident types reported to NFIRS in West Columbia, SC
- 1,81042.7%Outside Fires
- 1,56736.9%Structure Fires
- 82619.5%Mobile Property/Vehicle Fires
- 380.9%Other
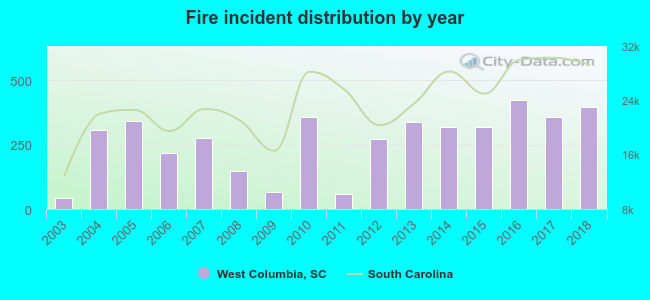 According to the data from the years 2003 - 2018 the average number of fires per year is 265. The highest number of fires - 422 took place in 2016, and the least - 44 in 2003. The data has a rising trend.
The average number of yearly fire incidents per 10k residents in West Columbia, SC compared to nearest cities:
(Note: Based on data for the last 3 years, including only cities with population 5,000 and above)
| West Columbia: | 246.6 |
| Cayce: | 59.5 |
| Oak Grove: | 1.0 |
| Columbia: | 115.1 |
| Forest Acres: | 5.2 |
| Lexington: | 285.2 |
| Irmo: | 83.5 |
| Hopkins: | 127.9 |
| Lugoff: | 130.0 |
 The median response time based on all reported fire incidents is 6 minutes. This is comparable to the state median value.
The median response time in West Columbia, SC compared to nearest cities:
(Note: Based on data for all years, including only cities with at least 500 fire incidents)
| West Columbia: | 6 minutes |
| Cayce: | 5 minutes |
| Columbia: | 7 minutes |
| Lexington: | 7 minutes |
| Irmo: | 8 minutes |
| Gaston: | 8 minutes |
| Hopkins: | 9 minutes |
| Blythewood: | 9 minutes |
| Swansea: | 8 minutes |
 According to the data from the years 2003 - 2018 the average number of fire-related yearly deaths is 1. The highest number of deaths - 2 took place in 2012, and the lowest - 0 in 2003. The data has a constant trend.
The average number of fatalities per 1,000 fire incidents is 2. This indicator was the highest - 7 in 2012, and the lowest 0 in 2003. The trend for deaths per 1,000 fires is constant. Compared to the state value the number of deaths per 1,000 incidents is lower.
According to the data from the years 2003 - 2018 the average number of fire-related yearly deaths is 1. The highest number of deaths - 2 took place in 2012, and the lowest - 0 in 2003. The data has a constant trend.
The average number of fatalities per 1,000 fire incidents is 2. This indicator was the highest - 7 in 2012, and the lowest 0 in 2003. The trend for deaths per 1,000 fires is constant. Compared to the state value the number of deaths per 1,000 incidents is lower.Deaths per 1,000 incidents in West Columbia, SC compared to nearest cities:
(Note: Based on data for all years, including only cities with at least 2,500 fire incidents)
| West Columbia: | 1.9 |
| Columbia: | 2.8 |
| Lexington: | 2.2 |
| Gaston: | 3.1 |
| Orangeburg: | 2.0 |
 According to the reports from the years 2003 - 2018 the average number of fire-related yearly casualties is 3. The highest number of casualties - 8 took place in 2015, and the lowest - 0 in 2003. The data has a growing trend.
The average number of injuries per 1,000 fires is 11. This indicator was the highest - 25 in 2015, and the lowest 0 in 2003. The trend for injuries per 1,000 incidents is increasing. Compared to the state value the number of casualties per 1,000 fire incidents is higher.
According to the reports from the years 2003 - 2018 the average number of fire-related yearly casualties is 3. The highest number of casualties - 8 took place in 2015, and the lowest - 0 in 2003. The data has a growing trend.
The average number of injuries per 1,000 fires is 11. This indicator was the highest - 25 in 2015, and the lowest 0 in 2003. The trend for injuries per 1,000 incidents is increasing. Compared to the state value the number of casualties per 1,000 fire incidents is higher.
 30.4% incidents where reported in the morning and 69.6% in the evening. The most fires (15.6%) took place on Saturday, and the least (13.7%) on Sunday.
 According to the 4,241 fires from years 2003 - 2018 most fires (10.7%) took place during March, and the least (7.4%) in October.
 Out of all 22,667 cases reported during the years 2003 - 2018, the most belonged to the categories: Rescue & EMS (39.7%), Fire (18.7%), and Hazardous Condition (12.0%).
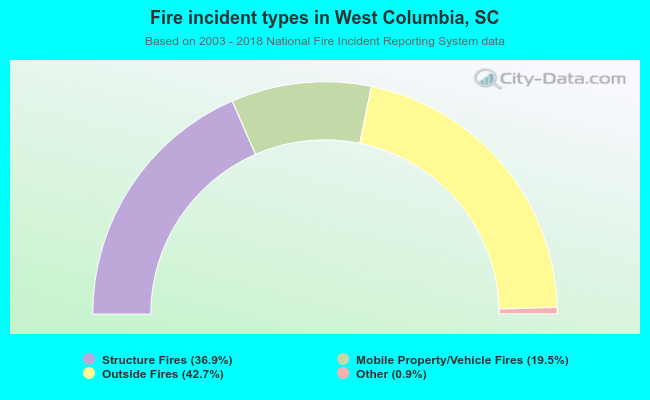 When looking into fire subcategories, the most incidents belonged to: Outside Fires (42.7%), and Structure Fires (36.9%).