Westlake: Fire Incidents, Ohio (OH)
Where are fire incidents reported in Westlake, OH
Something went wrong! Please refresh the page.
| Fire incidents reported | |
|---|---|
| Sreet name | Count |
| DETROIT RD | 456 |
| CENTER RIDGE RD | 288 |
| CLAGUE RD | 116 |
| CROCKER RD | 112 |
| COLUMBIA RD | 96 |
| DOVER CENTER RD | 92 |
| CLEMENS RD | 86 |
| CANTERBURY RD | 76 |
| BRADLEY RD | 66 |
| BASSETT RD | 64 |
| I90 | 64 |
| HILLIARD RD | 56 |
| I-90 | 56 |
| HILLIARD BLVD | 54 |
| SPERRY DR | 48 |
| MAIN ST | 44 |
| CROCKER PARK BLVD | 42 |
| KING JAMES PKY | 42 |
| WEYMOUTH CIR | 36 |
| CAROLINE CIR | 32 |
| CEDARWOOD DR | 32 |
| WESTWOOD | 32 |
| BRICK MILL RUN | 28 |
| FIRST ST | 28 |
| WESTFORD CIR | 26 |
| WESTLAKE VILLAGE DR | 26 |
| SCHWARTZ RD | 22 |
| WESTCHESTER PKY | 20 |
| CENTER RIDGE | 18 |
| ROSE RD | 18 |
2002 - 2018 National Fire Incident Reporting System (NFIRS) incidents
- Incident types reported to NFIRS in Westlake, OH
- 20,38066.8%Rescue & EMS
- 2,9289.6%False Alarm
- 2,2577.4%Hazardous Condition
- 1,8186.0%Fire
- 1,5805.2%Service Call
- 1,4654.8%Good Intent Call
- Fire incident types reported to NFIRS in Westlake, OH
- 99854.9%Structure Fires
- 58532.2%Outside Fires
- 23112.7%Mobile Property/Vehicle Fires
- 40.2%Other
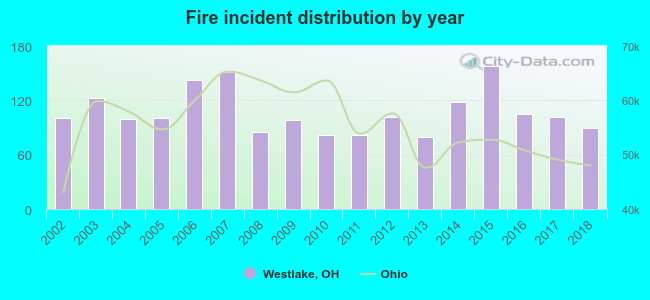 According to the data from the years 2002 - 2018 the average number of fires per year is 107. The highest number of reported fires - 158 took place in 2015, and the least - 80 in 2013. The data has a declining trend.
The average number of yearly fire incidents per 10k residents in Westlake, OH compared to nearest cities:
(Note: Based on data for the last 3 years, including only cities with population 5,000 and above)
| Westlake: | 30.5 |
| Bay Village: | 21.8 |
| North Olmsted: | 39.7 |
| Fairview Park: | 33.2 |
| Rocky River: | 30.0 |
| Avon: | 32.6 |
| Avon Lake: | 24.6 |
| North Ridgeville: | 19.5 |
| Olmsted Falls: | 40.9 |
 The median response time based on all reported fire incidents is 6 minutes. This is close to the Ohio median value.
The median response time in Westlake, OH compared to nearest cities:
(Note: Based on data for all years, including only cities with at least 500 fire incidents)
| Westlake: | 6 minutes |
| Bay Village: | 5 minutes |
| North Olmsted: | 4 minutes |
| Fairview Park: | 5 minutes |
| Rocky River: | 5 minutes |
| Avon: | 7 minutes |
| Avon Lake: | 6 minutes |
| North Ridgeville: | 6 minutes |
| Berea: | 5 minutes |
 Based on the data from the years 2002 - 2018 the average number of fire-related yearly deaths is 0. The highest number of deaths - 2 took place in 2007, and the lowest - 0 in 2002. The data has a constant trend.
 According to the reports from the years 2002 - 2018 the average number of fire-related casualties per year is 3. The highest number of injuries - 10 took place in 2014, and the lowest - 0 in 2010. The data has a dropping trend.
The average number of injuries per 1,000 fire incidents is 27. This indicator was the highest - 89 in 2005, and the lowest 0 in 2010. The trend for injuries per 1,000 fires is declining. Compared to the state value the number of injuries per 1,000 fires is higher.
According to the reports from the years 2002 - 2018 the average number of fire-related casualties per year is 3. The highest number of injuries - 10 took place in 2014, and the lowest - 0 in 2010. The data has a dropping trend.
The average number of injuries per 1,000 fire incidents is 27. This indicator was the highest - 89 in 2005, and the lowest 0 in 2010. The trend for injuries per 1,000 fires is declining. Compared to the state value the number of injuries per 1,000 fires is higher.Casualties per 1,000 incidents in Westlake, OH compared to nearest cities:
(Note: Based on data for all years, including only cities with at least 500 fire incidents)
| Westlake: | 27.5 |
| Bay Village: | 9.0 |
| North Olmsted: | 10.2 |
| Fairview Park: | 7.1 |
| Rocky River: | 13.3 |
| Avon: | 16.3 |
| Avon Lake: | 13.2 |
| North Ridgeville: | 11.0 |
| Berea: | 15.4 |
 32.6% incidents where reported in the morning and 67.4% in the evening. The most fires (18.0%) took place on Thursday, and the least (12.6%) on Wednesday.
 Based on the 1,818 fire incidents from years 2002 - 2018 most fires (10.6%) took place during May, and the least (5.3%) in February.
 Out of all 30,492 cases reported during the years 2002 - 2018, the most belonged to the categories: Rescue & EMS (66.8%), False Alarm (9.6%), and Hazardous Condition (7.4%).
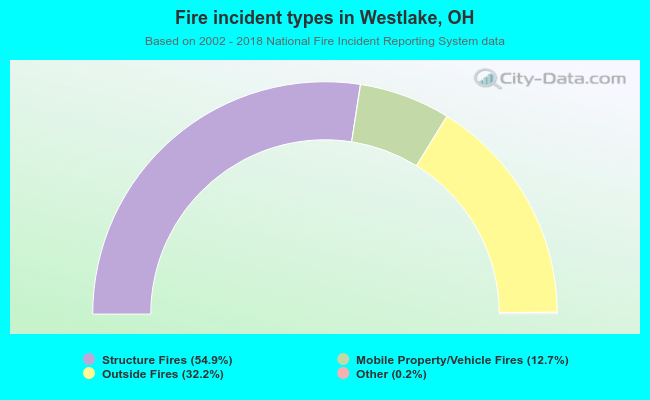 When looking into fire subcategories, the most reports belonged to: Structure Fires (54.9%), and Outside Fires (32.2%).