Willington: Fire Incidents, Connecticut (CT)
Where are fire incidents reported in Willington, CT
Something went wrong! Please refresh the page.
|
| |||||||||||||||||||||||||||||||||||||||||||||||||||||||||||||||||||||||||||||||||||||||||||||||||||||||||||||
2002 - 2018 National Fire Incident Reporting System (NFIRS) incidents
- Incident types reported to NFIRS in Willington, CT
- 77651.6%Rescue & EMS
- 23215.4%Fire
- 16310.8%False Alarm
- 15710.4%Hazardous Condition
- 916.1%Good Intent Call
- 704.7%Service Call
- 140.9%Special Incident
- Fire incident types reported to NFIRS in Willington, CT
- 13658.6%Structure Fires
- 5423.3%Outside Fires
- 3515.1%Mobile Property/Vehicle Fires
- 73.0%Other
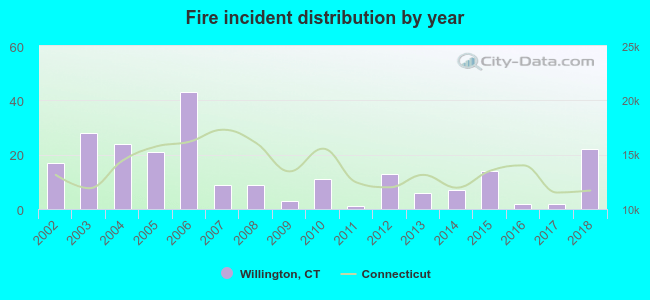 Based on the data from the years 2002 - 2018 the average number of fires per year is 14. The highest number of fires - 43 took place in 2006, and the least - 1 in 2011. The data has a rising trend.
The average number of yearly fire incidents per 10k residents in Willington, CT compared to nearest cities:
(Note: Based on data for the last 3 years, including only cities with population 5,000 and above)
| Willington: | 14.3 |
| Storrs: | 26.1 |
| Tolland: | 20.2 |
| Mansfield: | 6.8 |
| Stafford: | 10.2 |
| Coventry: | 10.2 |
| Ellington: | 14.3 |
| Vernon: | 18.4 |
| Willimantic: | 41.5 |

 32.3% incidents where reported in the morning and 67.7% in the evening. The most fires (18.1%) took place on Sunday, and the least (10.8%) on Tuesday.
 According to the 232 incident reports from years 2002 - 2018 most fires (18.1%) took place during January, and the least (3.4%) in August.
 Out of all 1,504 cases reported during the years 2002 - 2018, the most belonged to the categories: Overpressure Rupture (51.6%), Fire (15.4%), and Good Intent Call (10.8%).
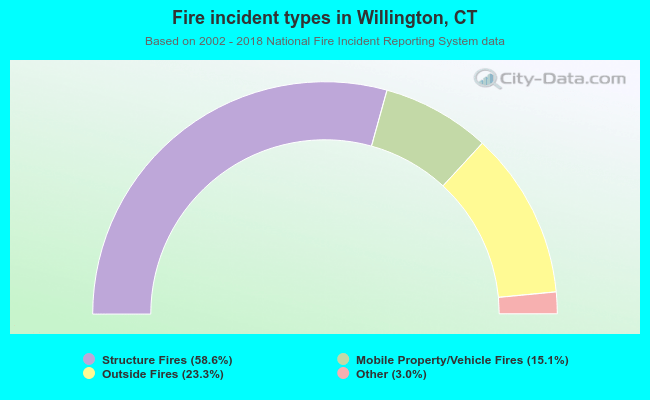 When looking into fire subcategories, the most reports belonged to: Structure Fires (58.6%), and Outside Fires (23.3%).