Woodmere: Fire Incidents, New York (NY)
Where are fire incidents reported in Woodmere, NY
Something went wrong! Please refresh the page.
|
| |||||||||||||||||||||||||||||||||||||||||||||||||||||||||||||||||||||||||||||||||||||||||||||||||||||||||||||
2003 - 2018 National Fire Incident Reporting System (NFIRS) incidents
- Incident types reported to NFIRS in Woodmere, NY
- 93328.0%Rescue & EMS
- 73622.1%False Alarm
- 60218.1%Hazardous Condition
- 43513.1%Fire
- 41612.5%Service Call
- 1985.9%Good Intent Call
- 80.2%Severe Weather
- Fire incident types reported to NFIRS in Woodmere, NY
- 32474.5%Structure Fires
- 6114.0%Other
- 337.6%Outside Fires
- 173.9%Mobile Property/Vehicle Fires
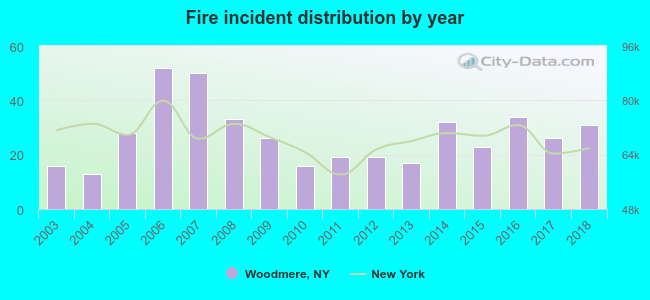 According to the data from the years 2003 - 2018 the average number of fires per year is 27. The highest number of fires - 52 took place in 2006, and the least - 13 in 2004. The data has a growing trend.
The average number of yearly fire incidents per 10k residents in Woodmere, NY compared to nearest cities:
(Note: Based on data for the last 3 years, including only cities with population 5,000 and above)
| Woodmere: | 17.7 |
| Cedarhurst: | 28.5 |
| Hewlett: | 12.7 |
| Inwood: | 65.4 |
| Lawrence: | 38.2 |
| Valley Stream: | 12.8 |
| East Rockaway: | 1.5 |
| Lynbrook: | 6.6 |
| Malverne: | 6.2 |

 Based on the reports from the years 2003 - 2018 the average number of fire-related yearly casualties is 0. The highest number of injuries - 2 took place in 2005, and the lowest - 0 in 2003. The data has a constant trend.
 33.8% incidents where reported in the morning and 66.2% in the evening. The most fires (18.9%) took place on Friday, and the least (10.8%) on Wednesday.
 According to the 435 reports from years 2003 - 2018 most fires (10.6%) took place during December, and the least (6.4%) in March.
 Out of all 3,330 cases reported during the years 2003 - 2018, the most belonged to the categories: Rescue & EMS (28.0%), False Alarm (22.1%), and Hazardous Condition (18.1%).
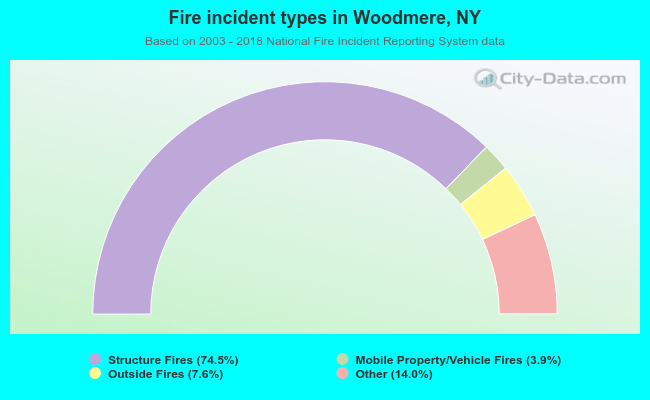 When looking into fire subcategories, the most incidents belonged to: Structure Fires (74.5%), and Other (14.0%).